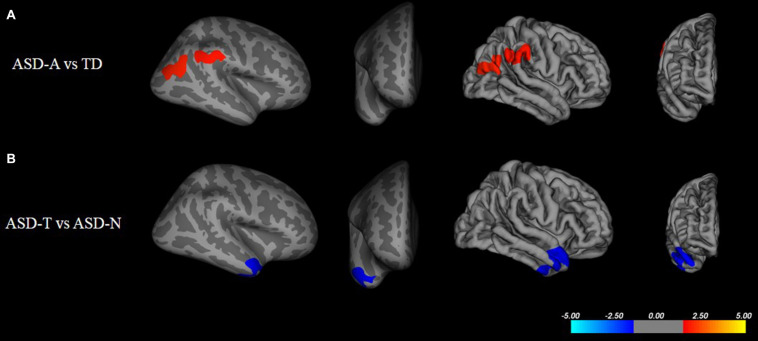
FIGURE 3.
Inflated and pial surface maps (dark gray, sulci; light gray, gyri) of the right hemispheres showing a decreasing local gyrification index in (A) inferior parietal and supramarginal areas in the TD group compared with that in the ASD-A group, (B) superior temporal gyrus (STG) in the ASD-A group compared with that in the ASD-T group. Significance threshold was set at p < 0.01 (cluster-corrected).

