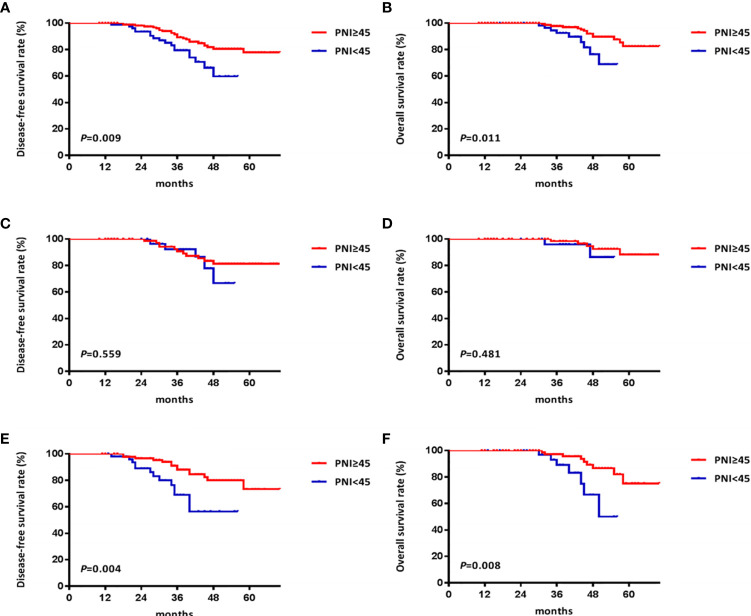
Figure 3.
Kaplan Meier survival curves of patients with locally advanced rectal cancer grouped by prognostic nutritional index (PNI) and stratified by clinical stage. (A) the disease-free survival (DFS) curves of all patients; (B) the overall survival (OS) curves of all patients; (C) the DFS curves of patients with clinical stage II rectal cancer; (D) the OS curves of patients with clinical stage II rectal cancer; (E) the DFS curves of patients with clinical stage III rectal cancer; (F) the OS curves of patients with clinical stage III rectal cancer.

