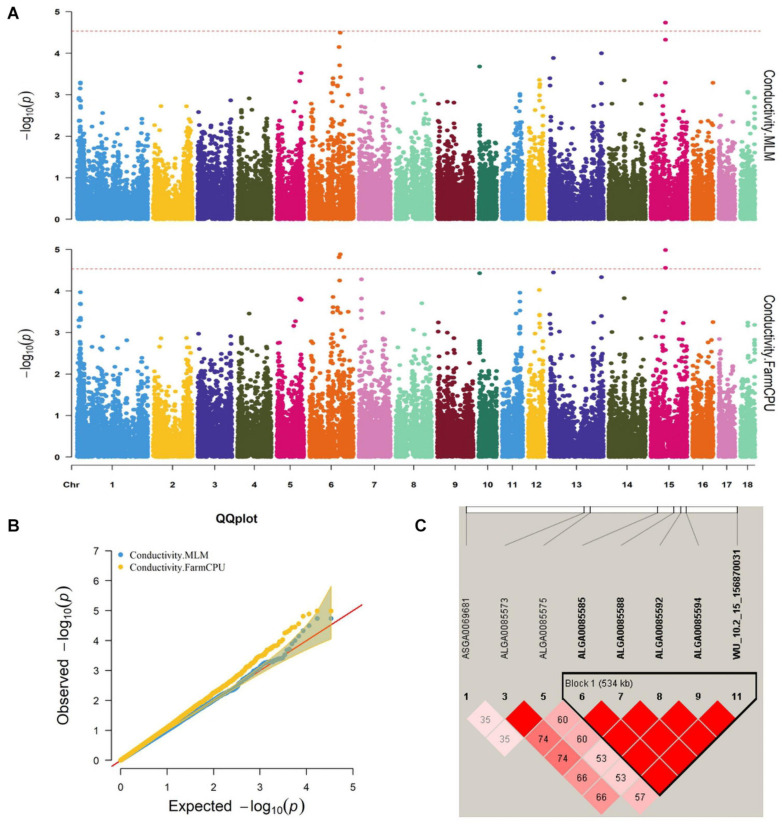
FIGURE 1.
(A) Manhattan plots. (B) Quantile–quantile (QQ) plots of the mixed linear model (MLM) and fixed and random model Circulating Probability Unification (FarmCPU) analyzed for conductivity traits in D (LY) pigs. (C) Haplotype blocks on SSC15, including all significant conductivity-associated single-nucleotide polymorphisms (SNPs).

