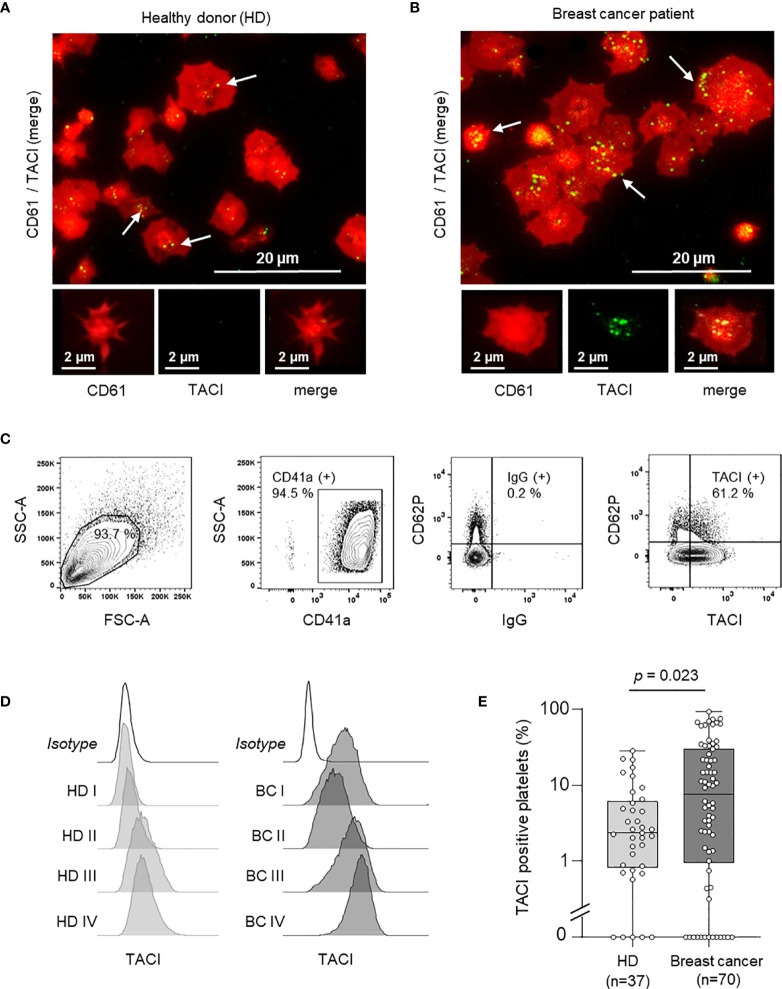
Figure 2.
Expression of platelet-derived TACI (pTACI). (A, B) Immunofluorescence analysis of pTACI (green) and CD61 (red) expression in platelets from representative HD. White arrows highlight TACI expression in HD and breast cancer patients. (A) and breast cancer patient (B). (C) Gating strategy used to analyze platelets ex vivo. (D) Surface pTACI level of platelets derived from HD and breast cancer patients were determined by flow cytometry. Representative results obtained from HD and breast cancer patients are shown. (E) The percentage of pTACI positive platelets in 37 HD and 70 breast cancer patients is shown. Within each box, horizontal lines denote 25th percentile, median, 75th percentile (bottom to top) of each group’s distribution values. Whiskers indicate maximal and minimal expression levels (p = 0.023).

