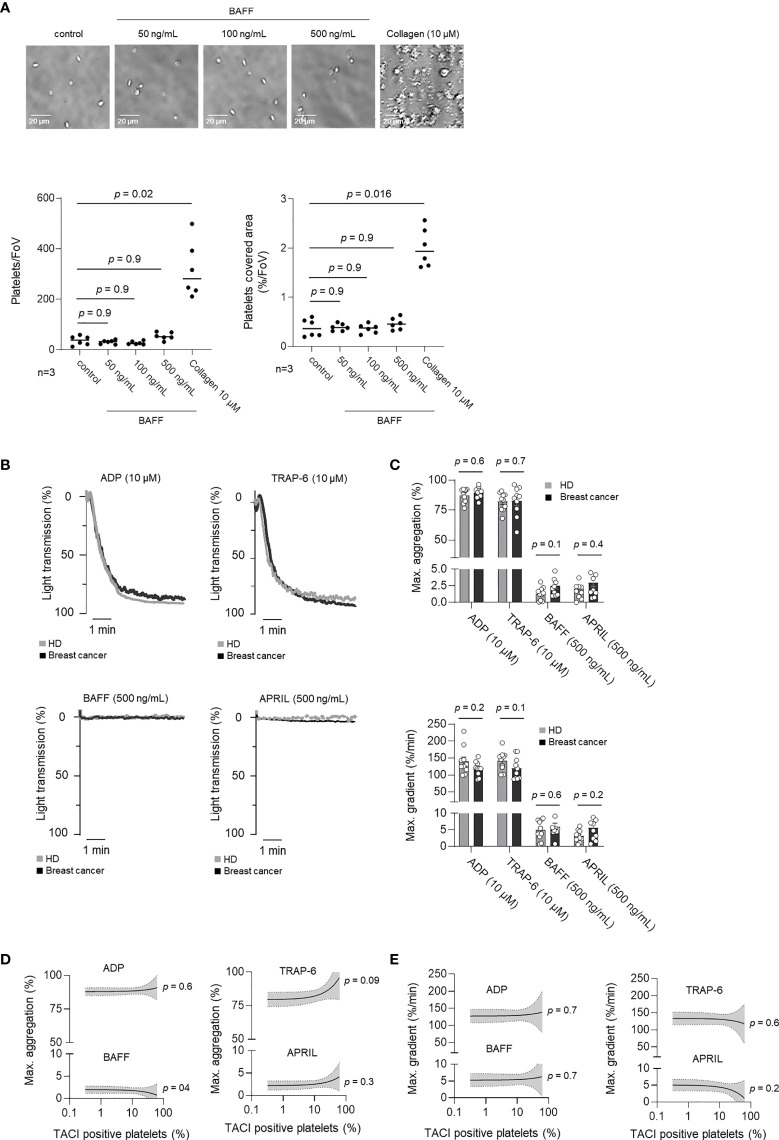
Figure 4.
Influence of BAFF and APRIL on pTACI on platelet activation. (A) Representative images of platelet adhesion in the presence or absence of rhBAFF (50-500 ng/mL) or collagen (10 µM). The lower left panel displays the quantitative analysis of the platelet adhesion assay per field of view (FoV). The lower right panel shows the quantitative analysis of platelet covered area per field of view (%/FoV). (B, C) Platelet aggregation was studied in the presence or absence of classical platelet agonists ADP, TRAP-6 (upper panel) or TACI ligands BAFF, APRIL (lower panel). Percentage of light transmission during the indicated time interval (B) and maximum aggregation levels or gradient (C) are shown. Dots indicate data obtained with individual HD (gray) and breast cancer patients (black) (n =10 each). The median value obtained from all donors within one group is indicated. (D, E) Correlation of maximum aggregation (D) or maximal gradient (E) and specific pTACI expression. Line indicates linear regression, gray area 95%CI interval.

