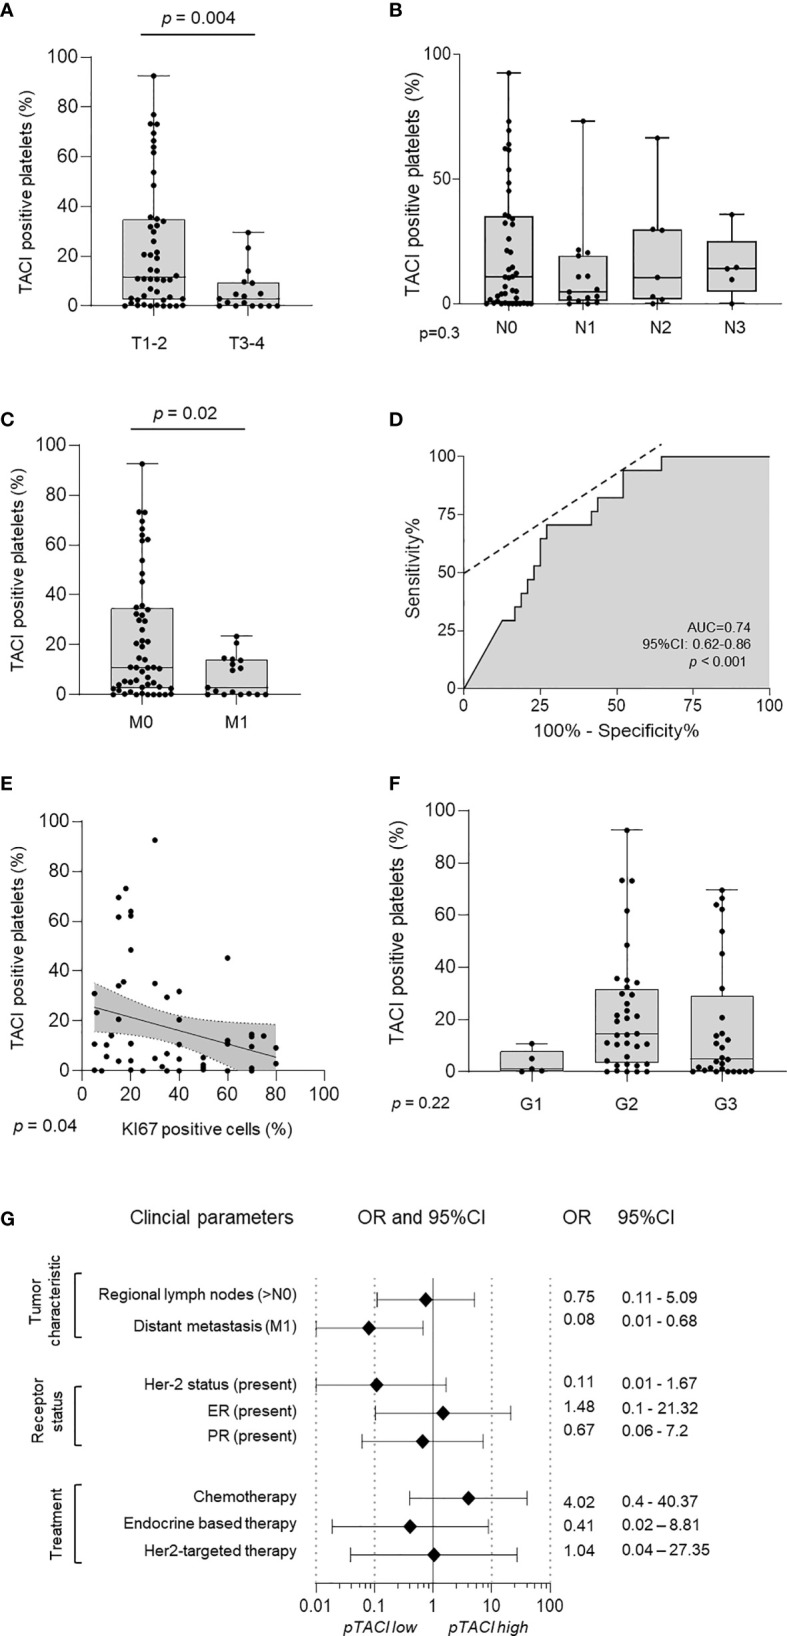
Figure 6.

Association of pTACI expression with prognostic parameters in breast cancer. (A–C) Expression of pTACI according to breast cancer tumor stages (T1-2, T3-4, p = 0.004) (A), lymph node invasion (N0-3, p = 0.3) (B) or occurrence of metastasis (M0-1, p = 0.02) (C). (D) The predictive value of pTACI expression for metastasis was analyzed using ROC (Area under the ROC curve, AUC 0.74, 95%CI: 0.62-0.86, p < 0.001). (E, F) Correlation of pTACI level and tumor proliferation (% Ki67 positive tumor cells) (p = 0.04) (E) and different tumor grades (G1-3, p = 0.22) (F). (G) Odds ratios (OR) of several clinical parameters and their association with pTACI level are shown. pTACI high was defined as follows: mean pTACI (HD) + 2SD pTACI (HD).
