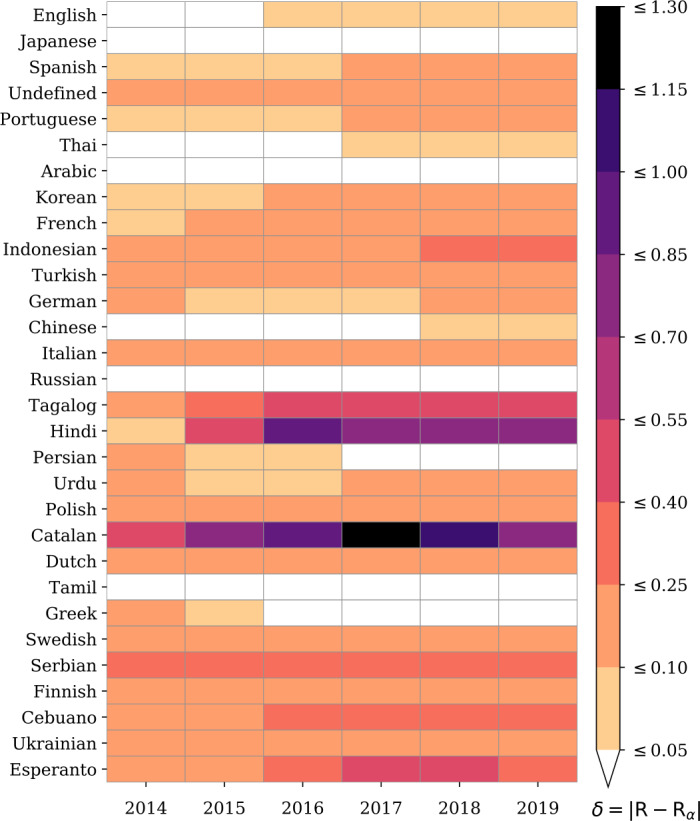
Figure 10.

Margin of error for contagion ratios. We compute the annual average of contagion ratios R for all messages in the top 30 ranked languages as classified by FastText-LID and described in Sect. 3.3. Similarly, we compute the annual average of contagion ratios for the subset of messages that both classifiers have unanimously labeled their language labels. We display the absolute difference to indicate our margin of error for estimating contagion ratios as a function of the agreement between FastText-LID and Twitter-LID models. White cells indicate that δ is below 0.05, whereas colored cells highlight values that are equal to, or above 0.05. We show the top 10 languages with the highest average values of δ’s per year in Table 4. We also show the bottom 10 languages with the lowest average values of δ’s per year in Table 5
