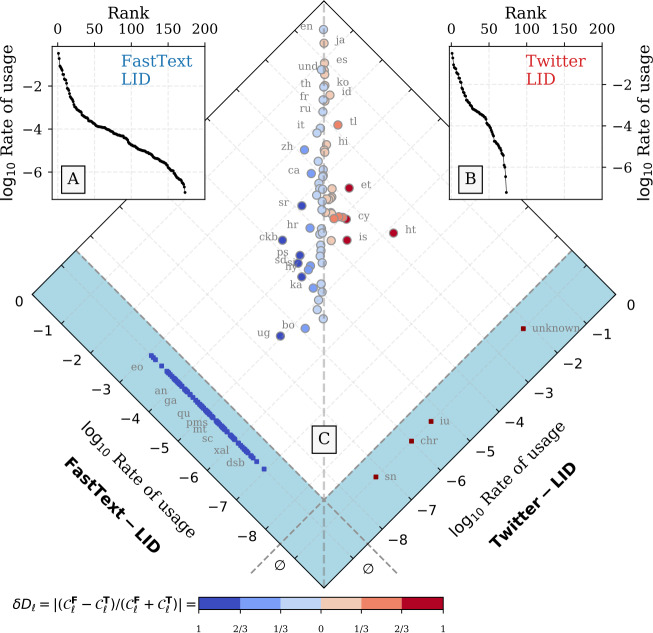
Figure 8.
Language Zipf distributions. (A) Zipf distribution [143] of all languages captured by FastText-LID model. (B) Zipf distribution for languages captured by Twitter-LID algorithm(s). The vertical axis in both panels reports rate of usage of all messages between 2014 and 2019, while the horizontal axis shows the corresponding rank of each language. FastText-LID recorded a total of 173 unique languages throughout that period. On the other hand, Twittert-LID captured a total of 73 unique languages throughout that same period, some of which were experimental and no longer available in recent years. (C) Joint distribution of all recorded languages. Languages located near the vertical dashed gray line signify agreement between FastText-LID and Twitter-LID, specifically that they captured a similar number of messages between 2014 and end of 2019. Languages found left of this line are more prominent using the FastText-LID model, whereas languages right of the line are identified more frequently by Twitter-LID model. Languages found within the light-blue area are only detectable by one classifier but not the other where FastText-LID is colored in blue and Twitter is colored in red. The color of the points highlights the normalized ratio difference (i.e., divergence) between the two classifiers, where is the number of messages captured by FastText-LID for language ℓ, and is the number of messages captured by Twitter-LID for language ℓ. Hence, points with darker colors indicate greater divergence between the two classifiers. A lookup table for language labels can be found in the Table 1, and an online appendix of all languages is also available here: http://compstorylab.org/storywrangler/papers/tlid/files/fasttext_twitter_timeseries.html

