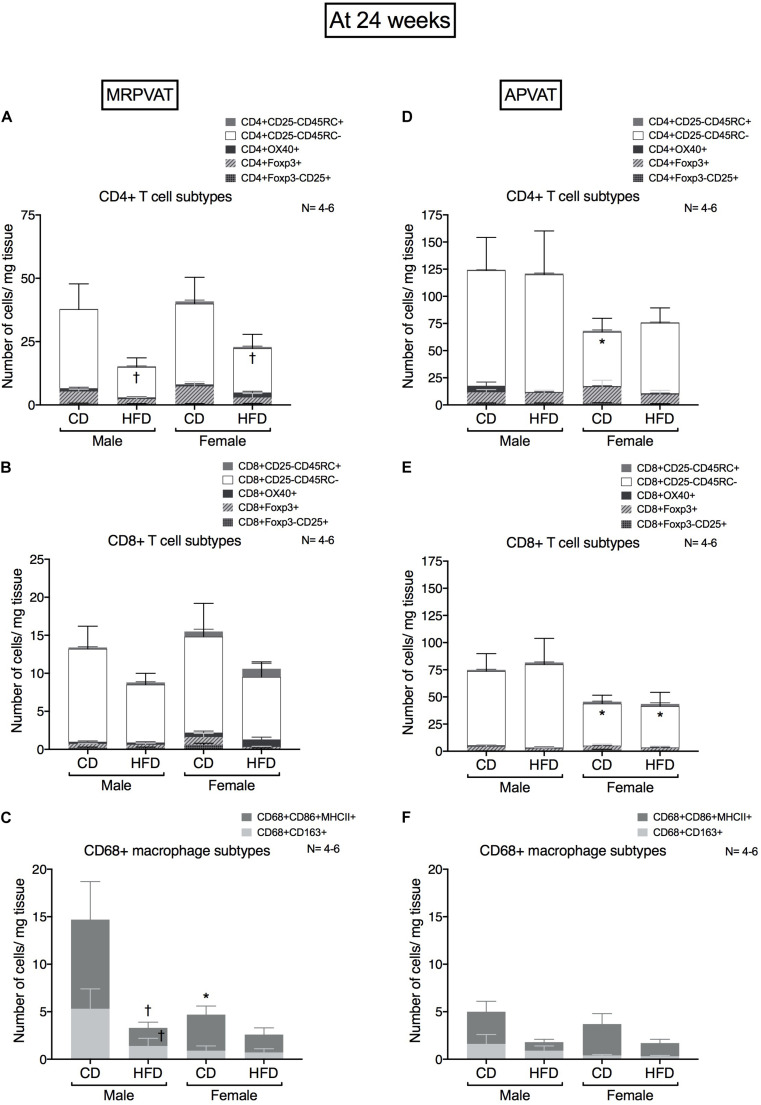
FIGURE 5.
Sex-differences in immune cells diminish with the progression of hypertension after 24 weeks on diet. Subtypes of CD4 +, CD8 + T cells and CD68 + macrophages in MRPVAT and APVAT of both sexes at 24 weeks on diet (hypertensive with HFD) were quantified by flow cytometry. Subtypes of CD4 + T cells (A,D), CD8 + T cells: cells (B,E), and CD68 + macrophages (C,F) were measured. Bars represent means ± SEM for the absolute cell counts of each immune cell type, normalized to tissue weight (in milligram). Number of animals is indicated by N. A P < 0.05 by two-way ANOVA with Tukey’s test for multiple comparison, was considered statistically significant. * and † inside/outside the stacks in the graph represent a significant difference in the specific stack of immune cells/sum total of immune cells between the sexes within each diet and between the diets within each sex respectively.

