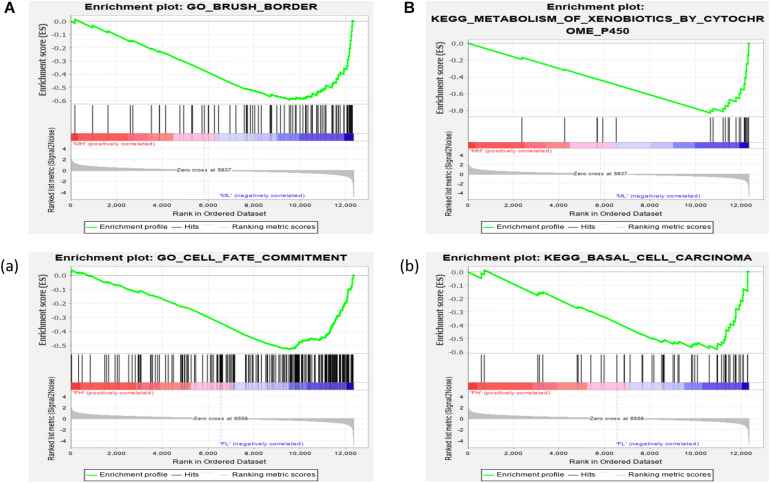
FIGURE 5.
Gene set enrichment analysis (GO-base and KEGG-base). GSEA algorithm scored the enrichment of genes in the pathway in the ranked gene list. Enrichment score (ES) > 0 indicates that the distribution of the gene set is biased upstream of the ranking list, and ES < 0 shows the gene set distribution is biased downstream of the ranking list. (A,B), (a,b) represent the GO entries and KEGG signaling pathways with the lowest FDR values. (A) Brush border and (B) Metabolism of xenobiotics by cytochrome p450 are enriched in the male LRFI groups. (a) Cell fate commitment and (b) Basal cell carcinoma are enriched in LRFI groups in the female.

