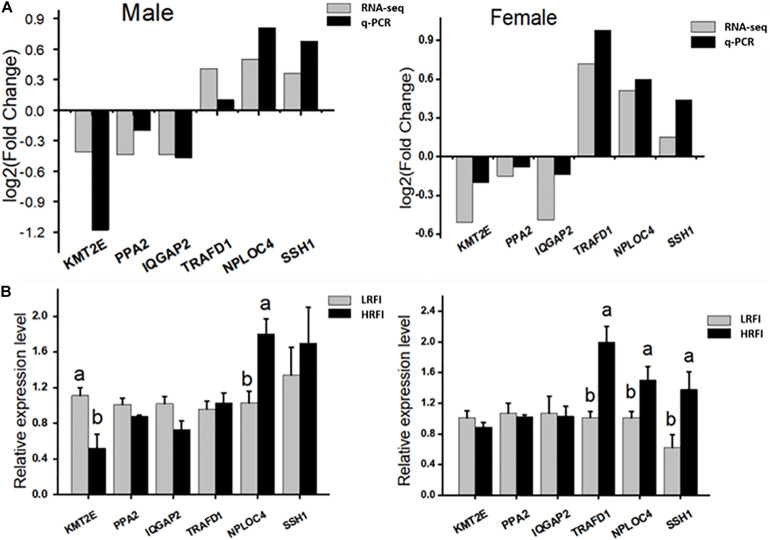
FIGURE 6.
Validation of the accuracy of RNA-seq. (A) Correlations of the expression level of 6 random DEGs between high and low abdominal fat using RNA-Seq and qPCR. The x- and y-axis correspond to the genes and log2 (ratio of H/L) measured by RNA-Seq and qPCR. (B) Gene expression abundance of HRFI and LRFI in Male and female; results are expressed as means ± standard deviation (n = 6); a, b means p < 0.05.

