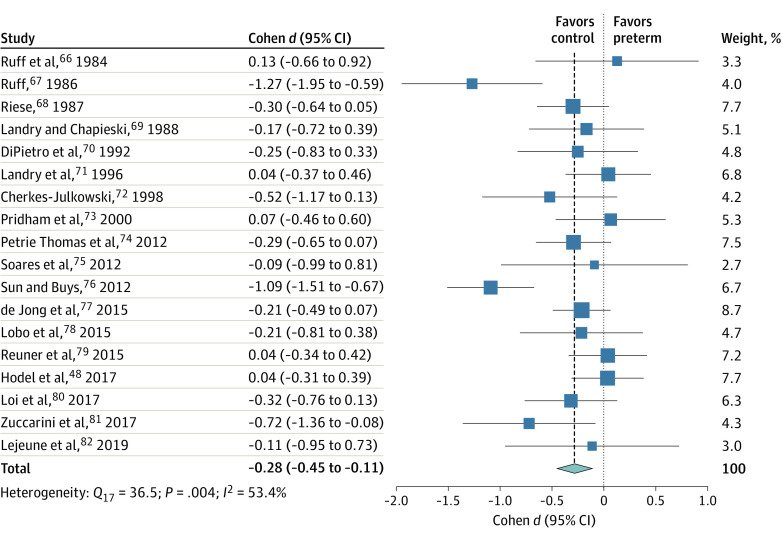
Figure 4. Forest Plot for the Differences in Focused Attention Between Infants Born Preterm and Full-term.
Squares represent point estimates, with the marker size indicating weight; horizontal lines represent 95% CIs. Diamonds represent the pooled point estimate, with the points indicating the 95% CI.

