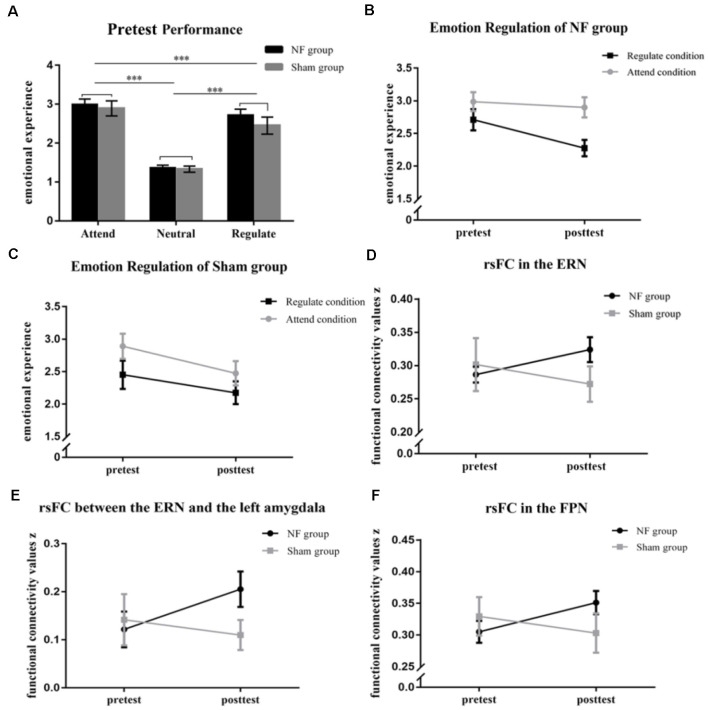
Figure 3.
(A) The graph shows the emotional rating of the NF and Sham groups at the pretest of the emotion regulation (ER) task. The figures represent the changes in emotional experience in the Regulate and Attend conditions (B,C). The rsFC was significantly enhanced within the ERN (D) and between the ERN and the left amygdala (E) in the NF group, but not the sham group, across rt-fNIRS-nf training. (F) The picture represents the changes in rsFC within the FPN in the NF and Sham groups across rt-fNIRS-nf training. ***p < 0.001.

