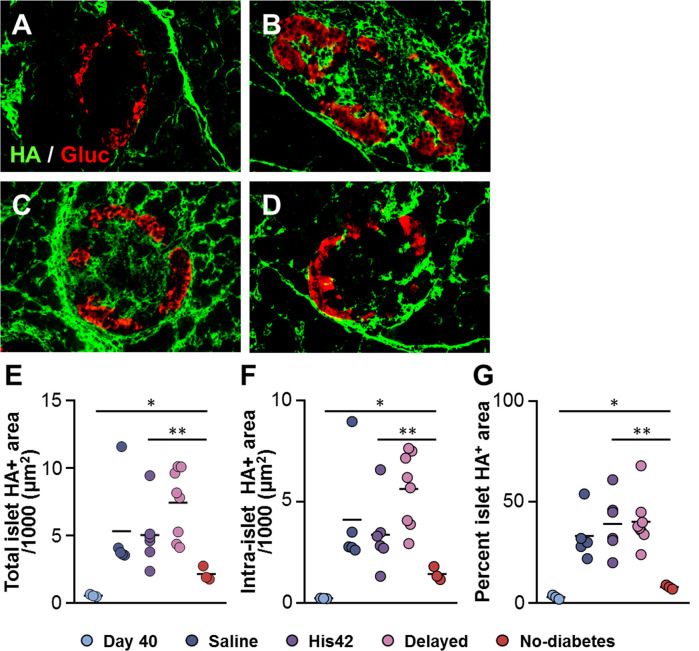
Figure 4.
Reduction in islet hyaluronan (HA) in 17D5 no-diabetes DRLyp/Lyp rats. (A–D) HA (green) and glucagon (Gluc, red) staining in islets from DRLyp/Lyp rats at 40 days of age (A), and from rats in the saline (B), 17D5 delayed (C), and 17D5 no-diabetes (D) groups. Scale bar, 50 µm. To avoid redundancy, images from His42-treated rats are not shown. Morphometric quantification of total (E) and intra- (F) islet HA+ areas. (G) Relative proportion of islet areas stained for HA. Each circle denotes an individual rat; dark slate blue, saline (n = 5); purple, His42 (n = 6); pink, 17D5 delayed (n = 8); red, 17D5 no-diabetes (n = 3); light slate blue, 40 day old (n = 3). Data are mean values measurements obtained for each rat. The solid horizontal lines indicate the mean of the measurements in each group. *P < 0.05, 17D5 no-diabetes vs day 40; **P < 0.01, 17D5 no-diabetes vs saline, His42, or 17D5 delayed; Mann-Whitney U test.

