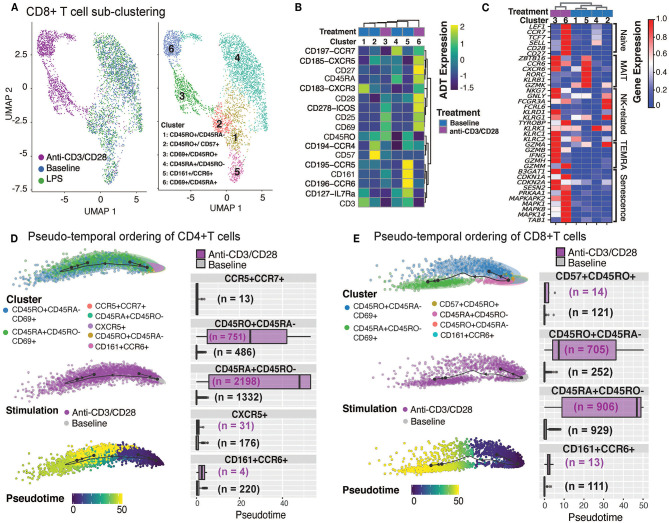
Figure 3.
Annotation of CD8+T cell subsets and trajectory inference. (A) Unsupervised clustering of CD8+ T cells from all conditions reveals a separation of anti-CD3/CD28-stimulated cells from all others. Dimension reduction plot with CD8+ T cells colored by their resultant cell-type identity. (B) Average scaled expression of protein markers used to also identify CD8+ T cell subpopulations. (C) Average scaled expression of marker genes associated with naïve, MAIT, NK, TEMRA, and senescence functions. Pseudo-temporal ordering of (D) CD4+ and (E) CD8+ T cells at baseline and anti-CD3/CD28 conditions. Boxplots show the distributions of pseudotime states for each of the baseline/activated T cell subsets.

