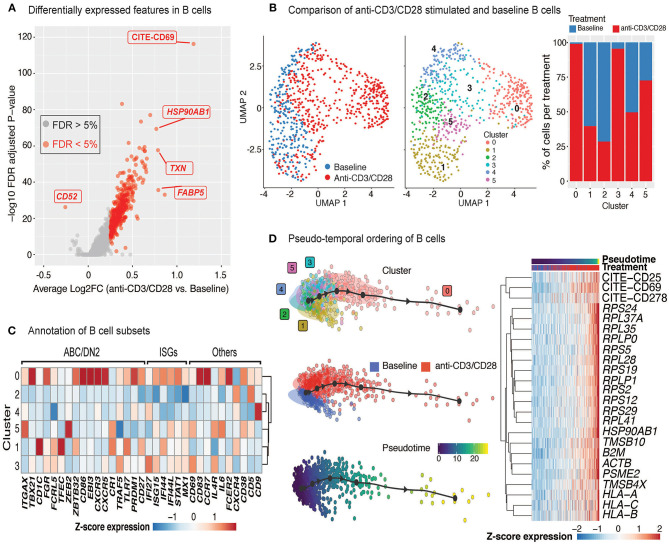
Figure 5.
Indirect activation of B cells. (A) Volcano plot summarizing the genes induced in anti-CD3/CD28-activated B cells relative to those at baseline. (B) Analysis of B cells at baseline and after anti-CD3/CD28 stimulation revealed six subgroups (middle). Primarily, anti-CD3/CD28-stimulated B cells clustered separately from those at baseline (left). Distribution of B cells in each cluster across the two conditions (right). Activated B cells were mostly in clusters 0 and 3. (C) Heatmap of age-associated B cell (ABC)/double negative 2 (DN2), interferon stimulated genes (ISGs), and other genes used to annotate the distinct B cell subpopulations. Values in each heatmap represent average scaled gene expression of all cells in the corresponding cluster. (D) (left) Pseudotime trajectory inference of B cells at baseline and anti-CD3/CD28 conditions. (right) Genes and proteins with temporal patterns of expression in pseudo-temporal ordered B cells.

