Figure 6.
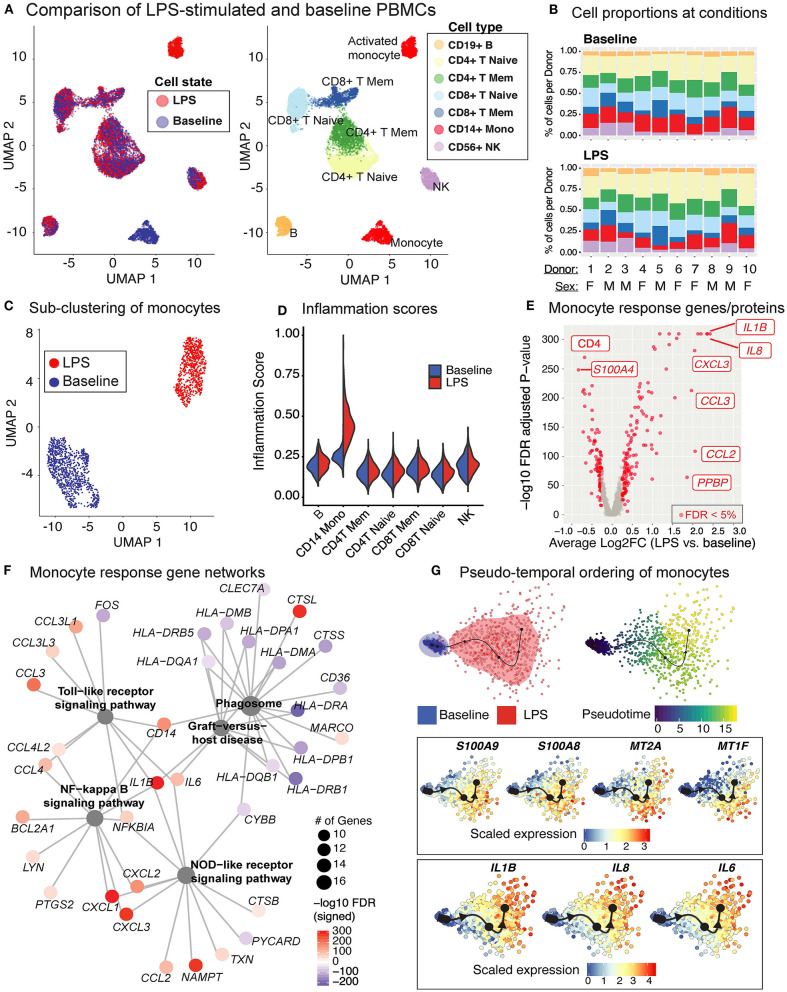
LPS stimulation specifically activates monocytes and induces pro-inflammatory responses. (A) Clustering of PBMCs under baseline and upon LPS stimulation (left). Cell types were annotated using the expression of cell surface proteins (right). (B) Cell type compositions at baseline (top) and LPS condition (bottom) across 10 donors. Refer to (A) for cell types' color coding. (C) Clustering of CD14+ monocytes separates baseline and LPS-stimulated cells. (D) Inflammation scores of all cells under two conditions. LPS-activated monocytes have the highest expression levels of inflammation-associated transcripts. (E) Differential expression analysis of LPS-stimulated and baseline monocytes revealed 125 induced and 94 reduced genes, respectively (FDR 5%), as well as 3 induced and 3 reduced proteins, respectively. (F) Enriched KEGG pathways (FDR 5%) for LPS response genes. Node size for each pathway represents the number of genes in the pathway that were also induced in LPS-stimulated monocytes. Node color for genes indicate induction (red) or reduction (blue) upon LPS treatment. LPS-activated monocytes upregulate genes associated with pattern recognition receptor signaling pathways (Toll-like receptor, NOD-like receptor) and inflammation (NF-kB signaling), but also downregulate genes associated with antigen presentation and phagosome activity. (G) Trajectory (pseudotime) inference of monocytes under baseline and LPS conditions identified genes with heterogeneous activity in stimulated monocytes. Cells are color-coded with respect to activation status (top left) and inferred pseudotimes (top right). Expression levels of selected genes were overlaid on cells sorted in the activation trajectory (bottom).

