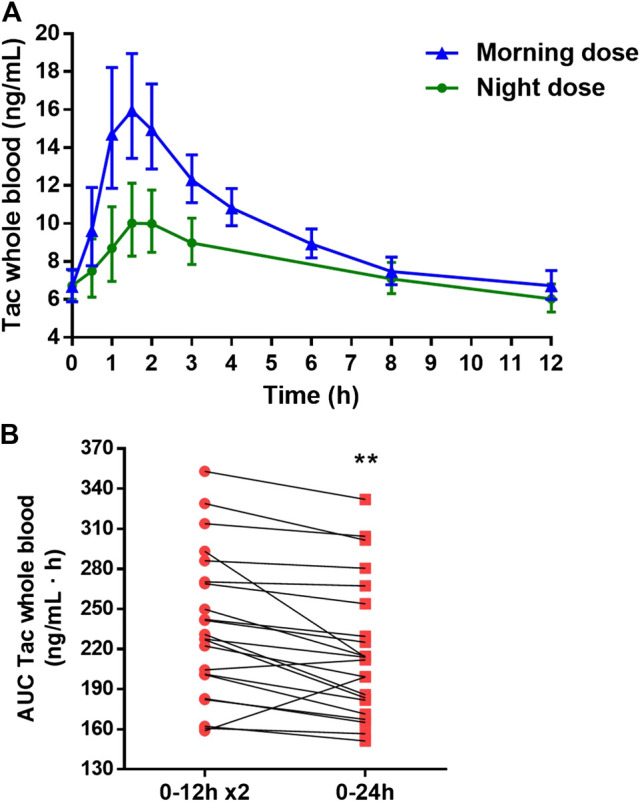
FIGURE 1.

(A) Whole blood tacrolimus (Tac) concentration-time profiles along 12 h dose interval after the administration of morning and night dose of twice-daily Tac. (B). Estimation of the total Tac daily exposure (AUC0–24 h) in whole blood (red square) by doubling the Tac exposure after the morning Tac dose (AUC0–12 x2) (red round). Each point joined by a line represented one patient. Paired t-test between both estimations was applied. **p < 0.01.
