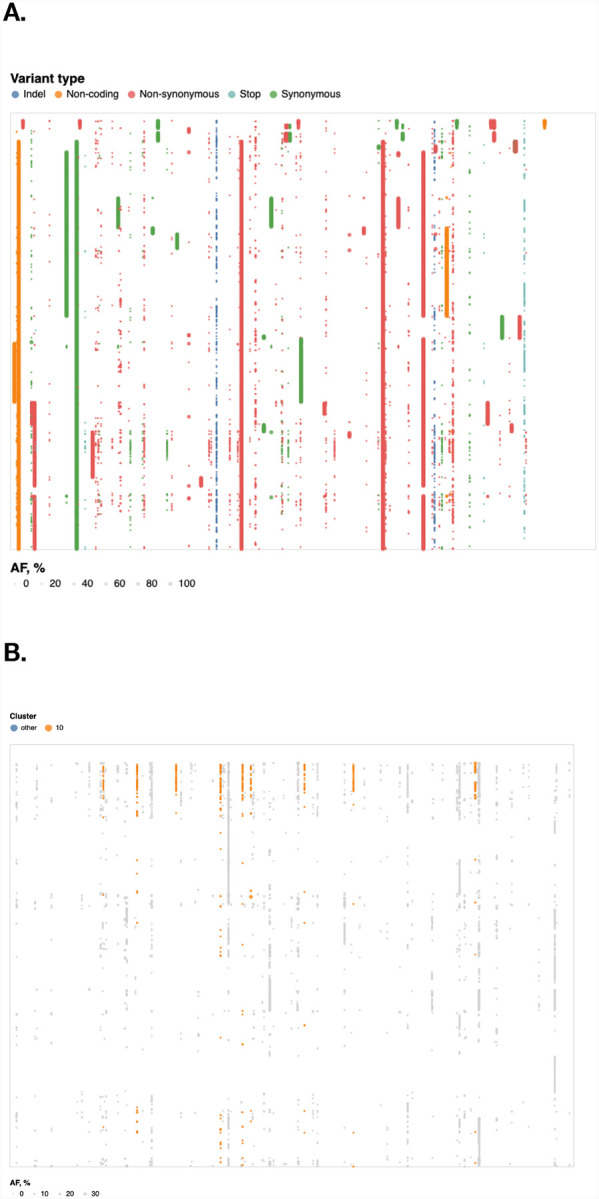
Figure 3.

Dot plot of all allelic-variants (AV) across samples in Boston dataset. X-axis: genome position, Y-axis: Samples, colors correspond to functional classes of AVs. Samples are arranged by hierarchical clustering using cosine distances on mean allele frequencies of all AVs. A. Dot-plot of all allelic variants in the “Boston” dataset; rows – samples, columns – genomic coordinates; samples are arranged by hierarchical clustering. Limited to variants that occur in at least 4 samples. B. Dot-plot of observed variants in the “Boston” dataset; restricted to variants that appear only at AF≤10% and occur in at least 4 samples each. Variants are partitioned into 10 clusters, using K-medoids using the Hamming distance on AF vectors; the cluster with 8 variants is highlighted in orange.
Interactive version is at https://observablehq.com/@spond/intrahost-variant-exploration-landing
