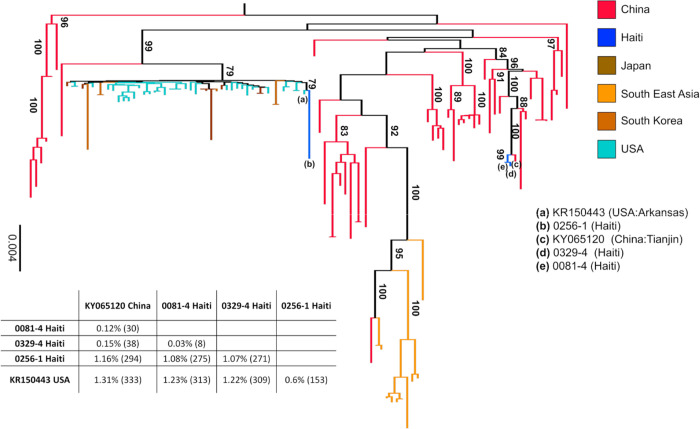
Figure 2 |. Maximum likelihood tree of PDCoV strains.
The tree was inferred from 109 PDCoV full genome sequences, including four sparrow CoV genomes for outgroup rooting (accession numbers MG812375, MG812376, MG812377, and MG812378, from Chen et al., 2018) using the best fitting nucleotide substitution model (see Methods). For display purposes, outgroup sequences were removed from the figure. Vertical branches are scaled in number of nucleotide substitutions per site according to the bar on the left of the tree. Bootstrap values > 75% (1000 replicates) are indicated along supported branches. The table at the bottom of the tree shows nucleotide % dissimilarity (and total number of nucleotide differences in parenthesis) between Haitian strains and their closest non-Haitian relatives, which are labelled in tree by progressive letters according to the legend on the right.

