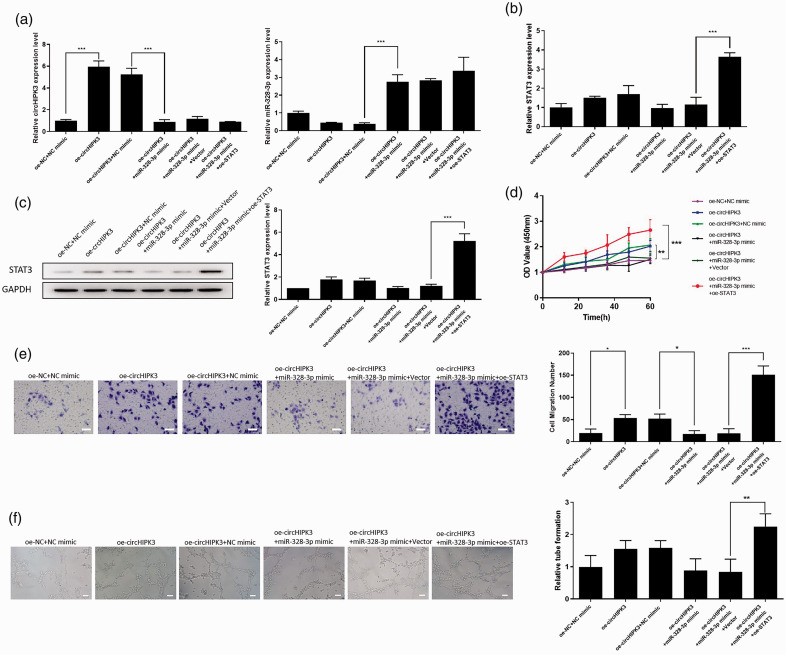
Fig. 6.
CircHIPK3 promoted the function of hPAECs through regulating the miR-328-3p/STAT3 axis. (a) qRT-PCR analysis for circHIPK3 and miR-328-3p in hPAECs from each group. (b) qRT-PCR detected the expression of STAT3 in hPAECs from each group at the mRNA level. (c) Western blot analysis for STAT3 protein in hPAECs from each group. (d) CCK-8 assay was performed to detect cell proliferation in different groups. (e) Transwell assay was used to measure cell migration in different groups, scale bar = 25 μm. (f) Representative images and graph of the numbers of tubules formed in each group, scale bar = 25 μm. Data were expressed as mean ± SD in three independent experiments. *P < 0.05, **P < 0.01, ***P < 0.001. STAT3: STAT3 overexpression vector pcDNA-STAT3; NC: negative control; OD: optical density.

