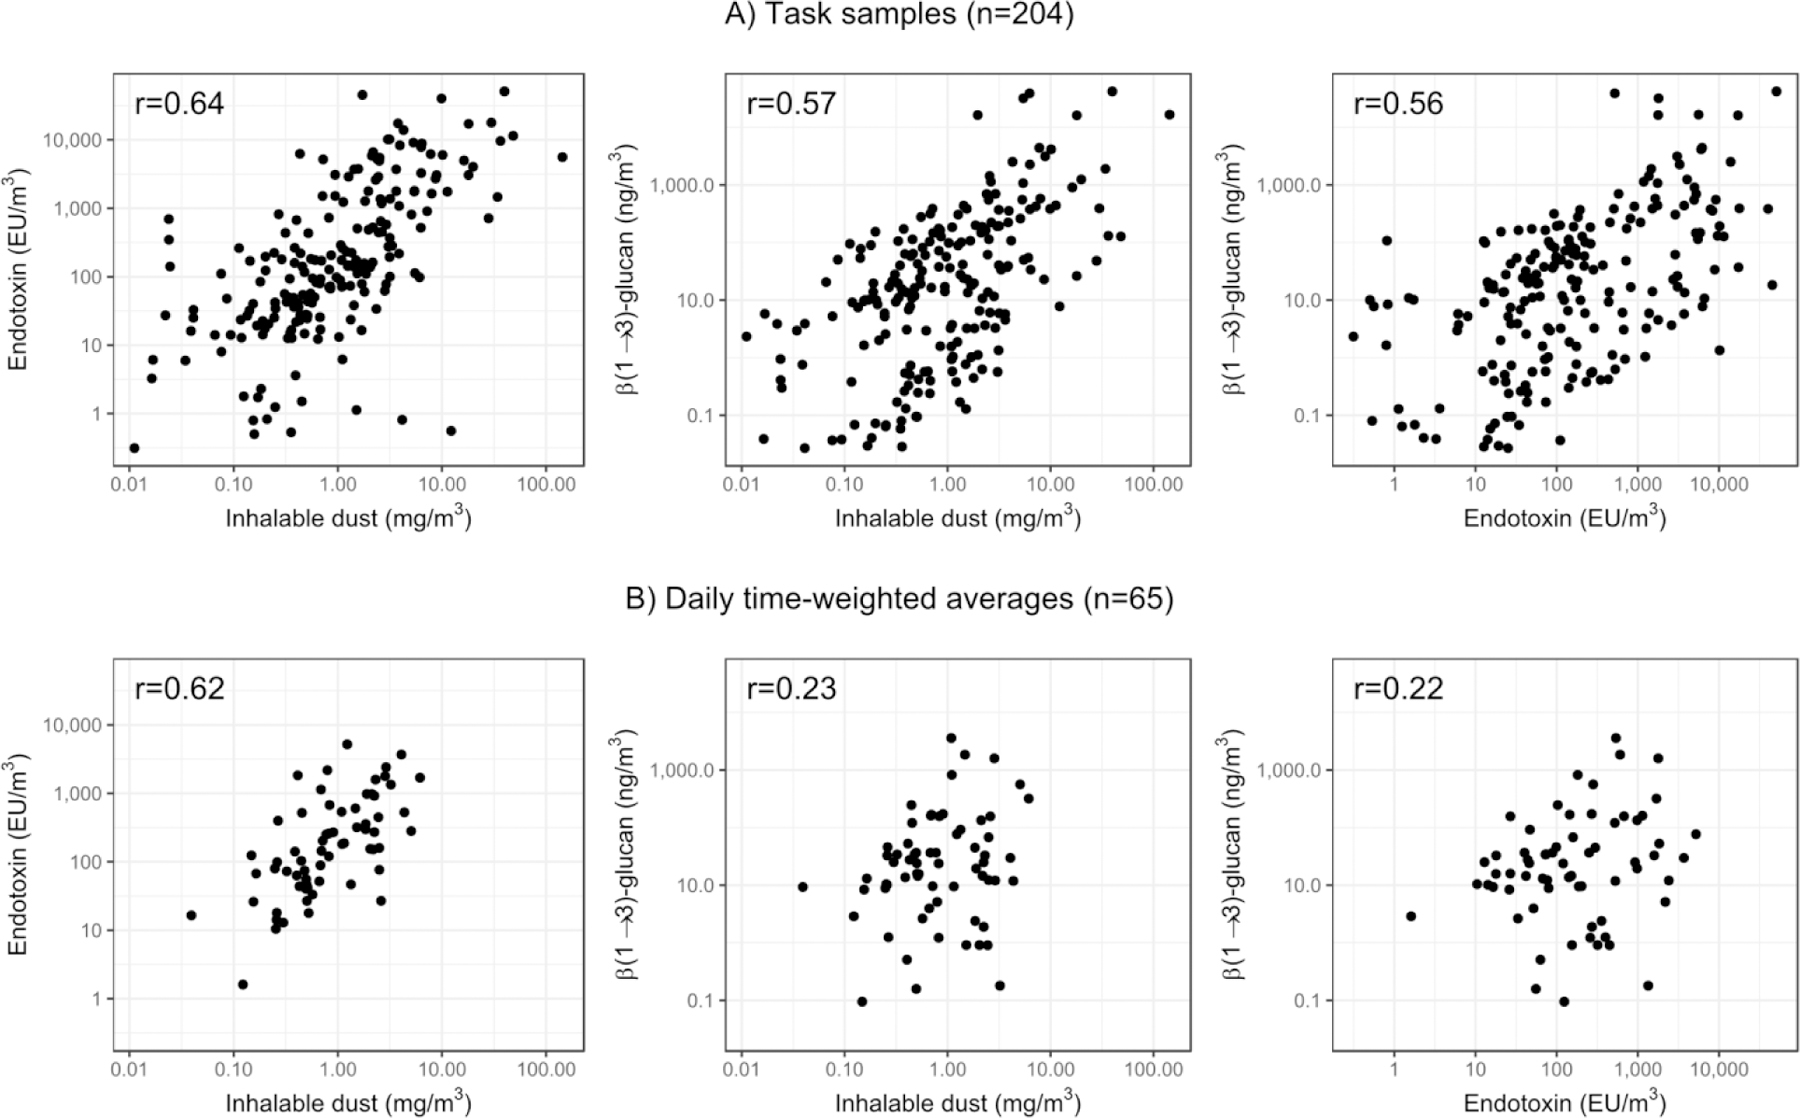
Figure 3.

Bivariate distributions of log-transformed endotoxin, glucan, and inhalable dust concentrations and pairwise Pearson’s correlations (r), for task samples and daily TWAs. The correlations and data points reported are the average values of the five imputations
