Fig. 1.
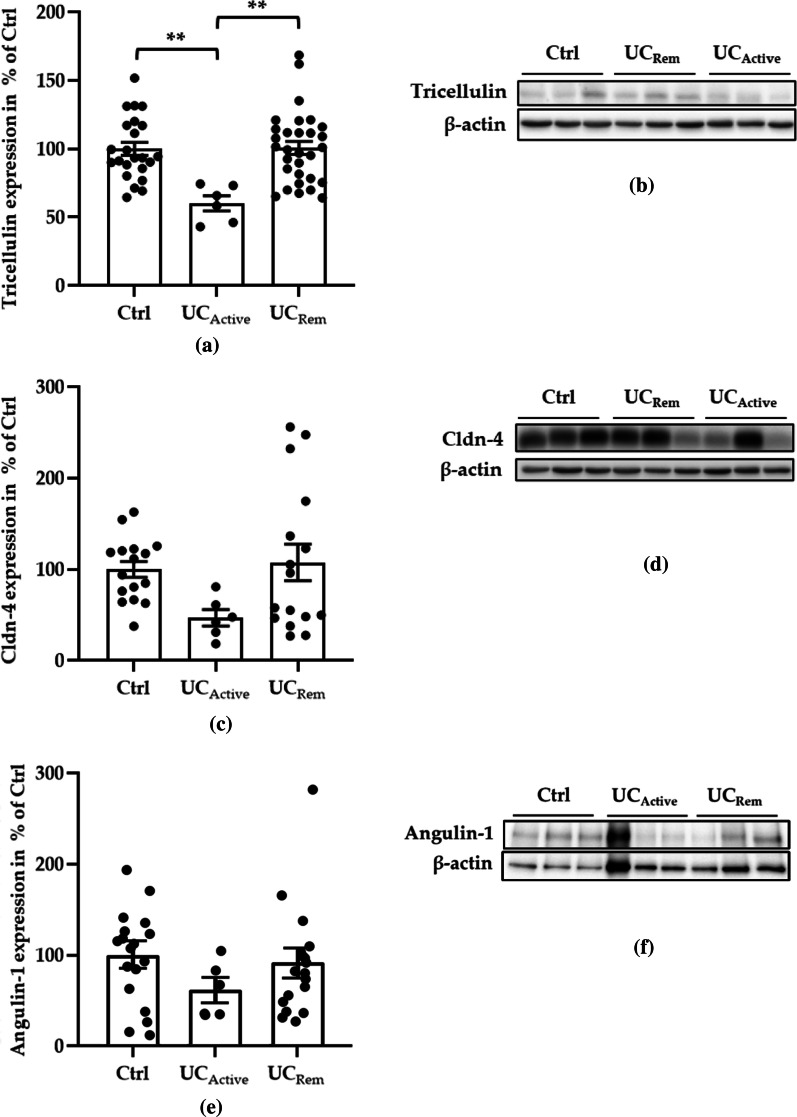
Tricellulin protein expression of human intestinal tissues. Mean value of Ctrl was set to 100%. a Combined scatter and bar plot of tricellulin of Ctrl, active UC (UCActive), and remission UC (UCRem). In active patients, tricellulin was downregulated compared to Ctrl. Importantly, in remission of UC, the expression of tricellulin returned to the level of Ctrl (Ctrl: 100 ± 4.75%, n = 23; UCActive: 60.22 ± 5.47%; UCRem: 100.69 ± 4.79%, n = 30, n = 6, **p < 0.01). b Representative western blots of tricellulin in Ctrl, UCRem and UCActive. c Scatter and bar plot of Cldn-4 of Ctrl (100 ± 8.70%, n = 16), UCActive (46.89 ± 9.03%, n = 6), and UCRem (107.63 ± 20.06%, n = 16). d Representative western blots of Cldn-4 in Ctrl, UCRem, and UCActive. e Scatter and bar plot of angulin-1 of Ctrl (100 ± 12.24%, n = 18), UCActive (61.45 ± 12.36%, n = 6, p = 0.2008) and UCRem (92.04 ± 14.49%, n = 18). f Representative western blots of angulin-1 from Ctrl, UCActive and UCRem

