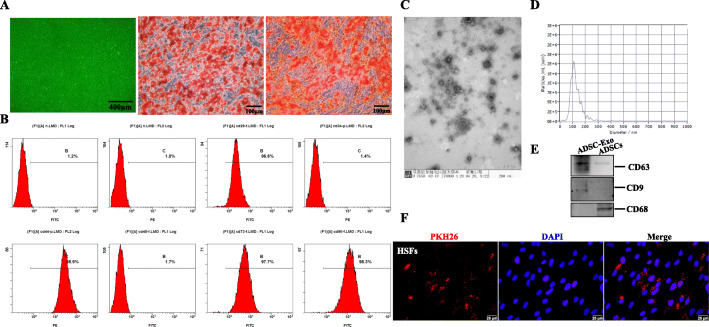
Fig. 1.
The identification of ADSCs and ADSC-Exo. a Optical morphology of human ADSCs under light field microscope, scale bars = 400 μm. Adipogenic and osteogenic differentiations measured by Oil Red O staining and Alizarin Red S staining, scale bars = 100 μm. b Representative flow cytometry analysis of ADSCs, the expression of mesenchymal stem cell surface markers (CD29 96.6%, CD44 98.9%, CD73 97.7%, CD90 98.3%) and hematopoietic stem cell surface markers (CD34 1.4%, CD45 1.7%). c The morphology of ADSC-Exo analyzed by TEM, scale bar = 200 nm. d The particle size distribution of ADSC-Exo measured by NTA. e Immunoblot analysis of known exosomal markers (CD9, CD63) and negative markers (CD68). f Representative images of the internalization of PKH-26-labeled ADSC-Exo into HSFs, scale bars = 25 μm

