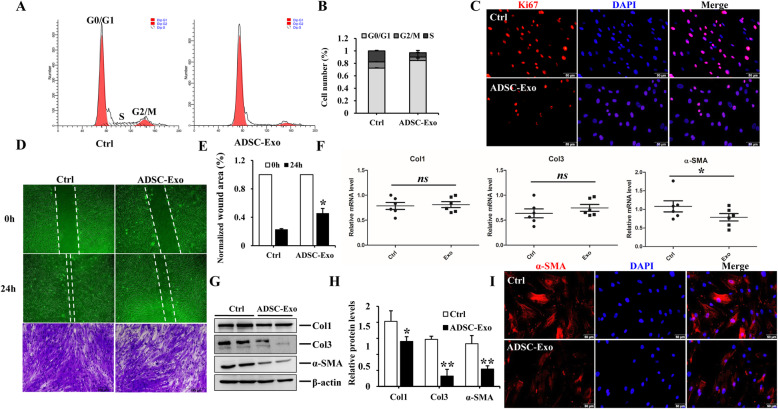
Fig. 2.
The effect of ADSC-Exo on HSFs. a, b Cell cycle analysis of HSFs exposed to ADSC-Exo or PBS. c Representative images of immunofluorescence staining of Ki67 in HSF exposure to ADSC-Exo or PBS, scale bar = 50 μm. d, e The effect of ADSC-Exo on HSF migration evaluated by the scratch wound assays and crystal violet staining, graphs showed the comparison of relative wound areas between ADSC-Exo and control group at 0 h and 24 h, original magnification (× 4 or × 10). f qRT-PCR analysis of the profibrotic factors in HSFs treated with ADSC-Exo or PBS, graph represented the expression of Col1, Col3, and α-SMA relative to that of GAPDH. g, h Immunoblot analysis of Col1, Col3, and α-SMA in HSFs stimulated with ADSC-Exo or PBS, the histogram demonstrated the relative band density to β-actin. i Representative images of α-SMA immunofluorescence staining in HSFs stimulated with ADSC-Exo or PBS, scale bar = 50 μm. The data was shown as mean ± SEM (*p < 0.05, **p < 0.01, ns: no differences)

