
Figure 2.
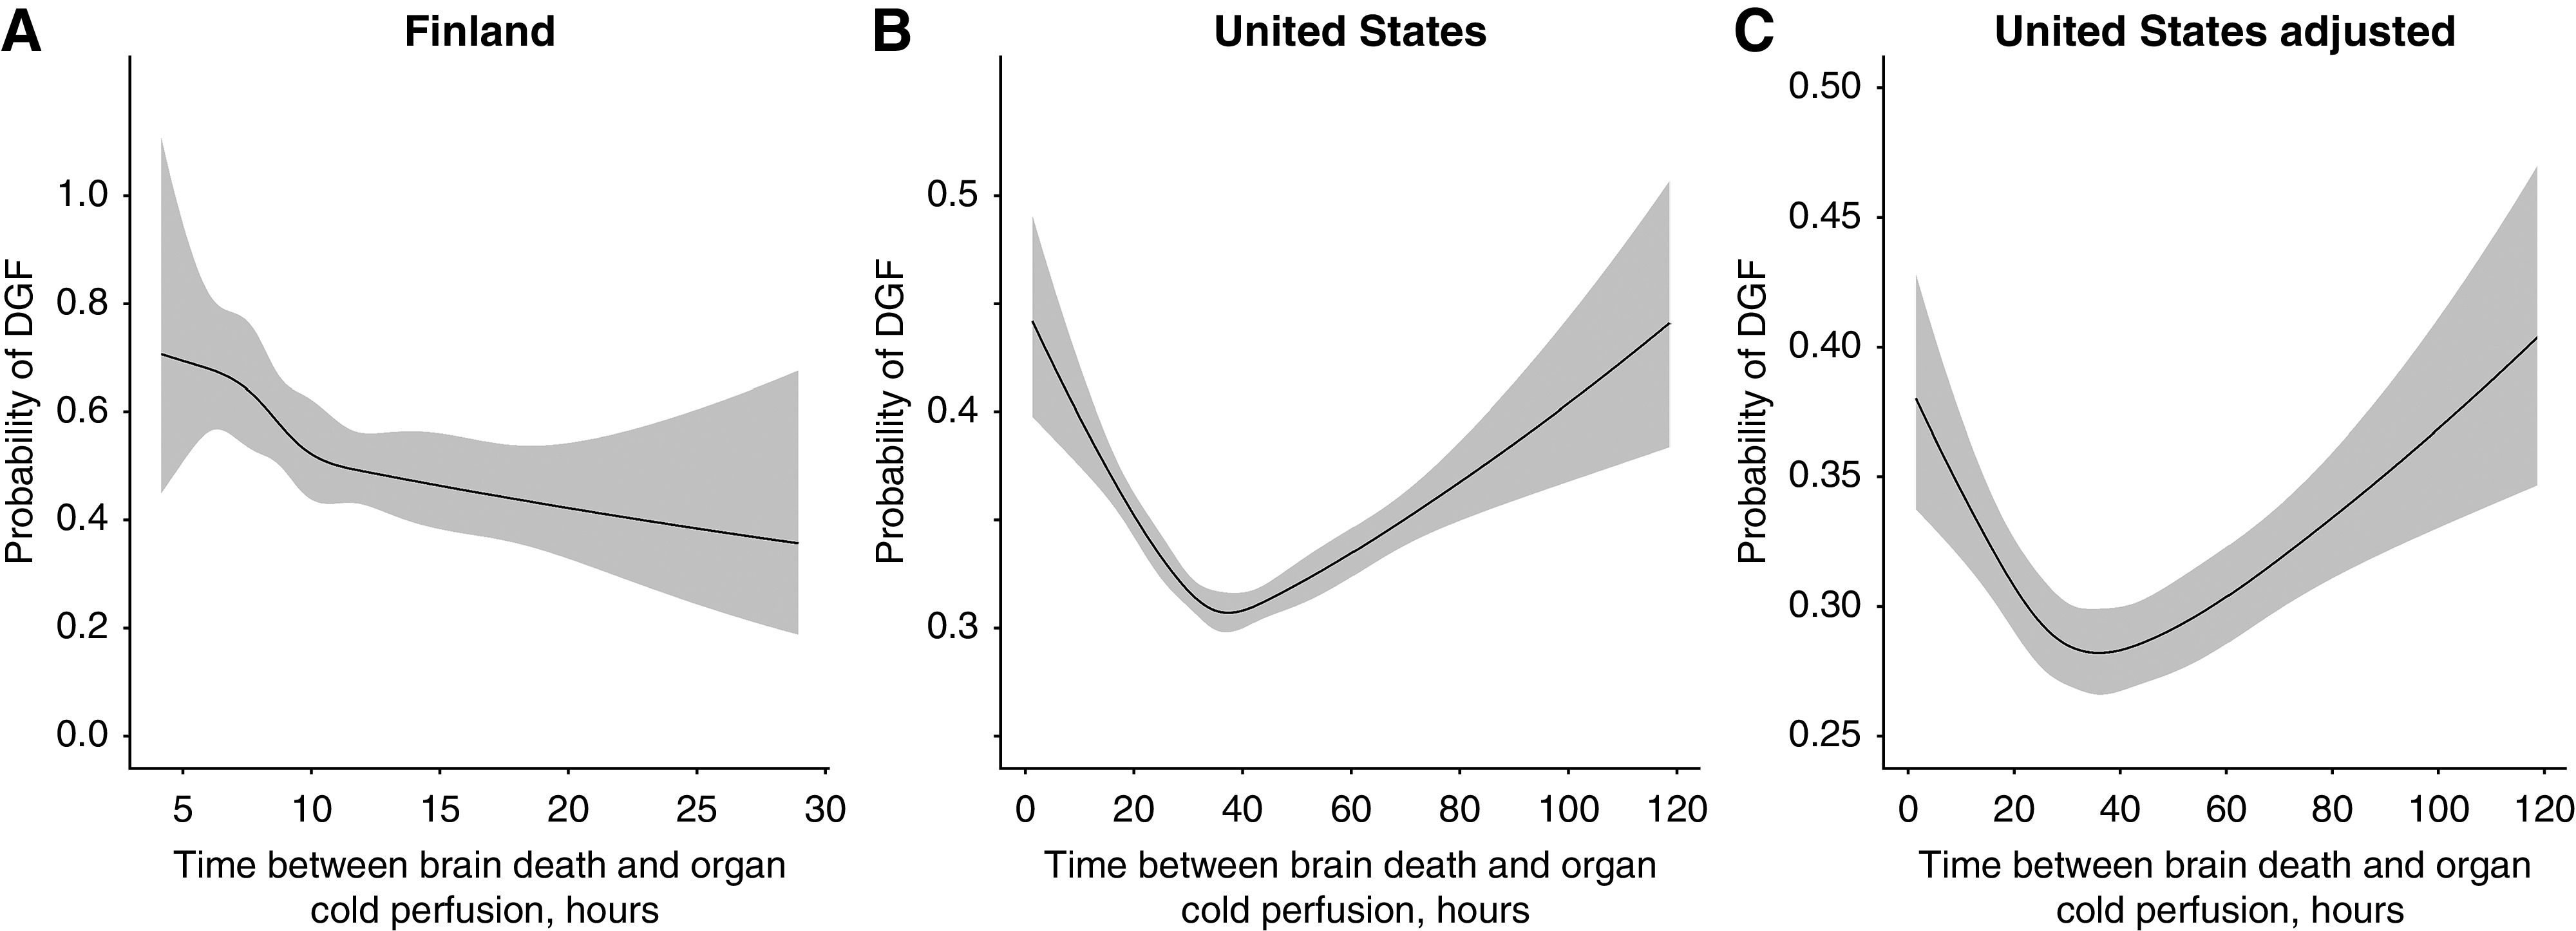
Association of procurement delay with delayed graft function. Gray areas correspond to 95% confidence bands. (A) Finnish cohort: P=0.67 for nonlinear association. (B) US cohort: P<0.001 for nonlinear association. (C) US cohort: P<0.001 for nonlinear association. Predicted values were calculated by setting confounder values to their median (Kidney Donor Profile Index =45, recipient age =53 years, dialysis vintage =45.57 months) or the most frequent category (no diabetes). DGF, delayed graft function.