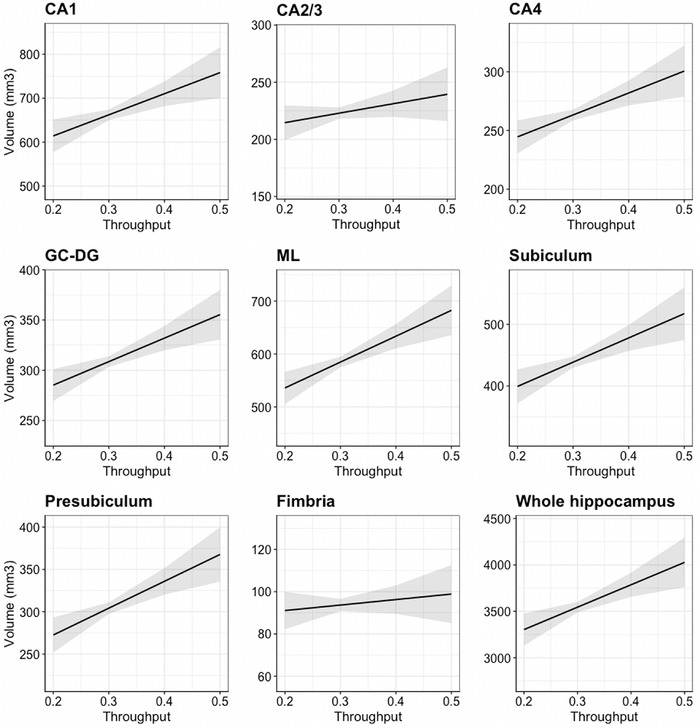
FIGURE 2.

Association between cognitive throughput performances of hippocampal subfield volumes and whole hippocampal volume adjusted for total intracranial volume (TIV). Regression models show the associations between throughput scores (higher score = better outcome) and hippocampal subfields or whole hippocampal volume adjusted for TIV. Y‐axis is scaled to mean ± 2.5 standard deviations of each subregion absolute volume. Sample size used in this analysis was 98 participants because one participant failed to complete the One Card Learning test that was used to calculate the throughput score and therefore was not included in this analysis. Abbreviations: CA, cornu ammonis; CG‐DG, granule cell layer of dentate gyrus; ML, molecular layer
