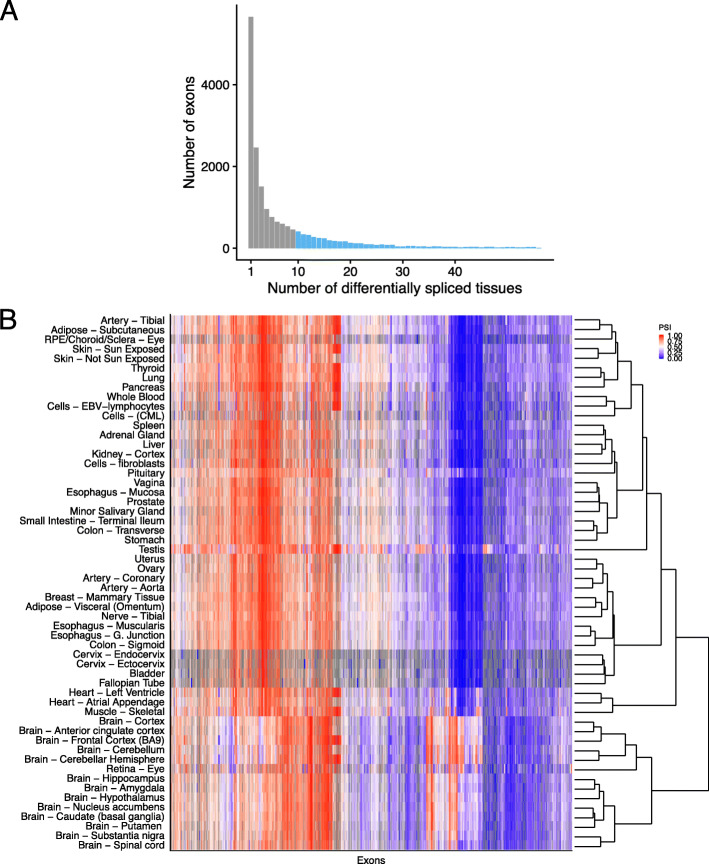
Fig. 1.
Differential splicing of alternatively spliced exons across tissues. a Histogram of the number of tissues with differential splicing (Ψ deviating by at least 10% from the exon-average Ψ). Overall, 4398 exons (light blue) are differentially spliced in at least 10 tissues. b. Heatmap of Ψ for the 4398 exons that are differentially spliced in at least 10 tissues with exons (columns) and tissues (rows) sorted by hierarchical clustering. Ψ is color-coded by a gradient from blue (0) to red (1) via white (0.5). Gray entries are missing values and occur in tissues for which the corresponding gene is not expressed. Hierarchical clustering was applied after imputing missing values with row means

