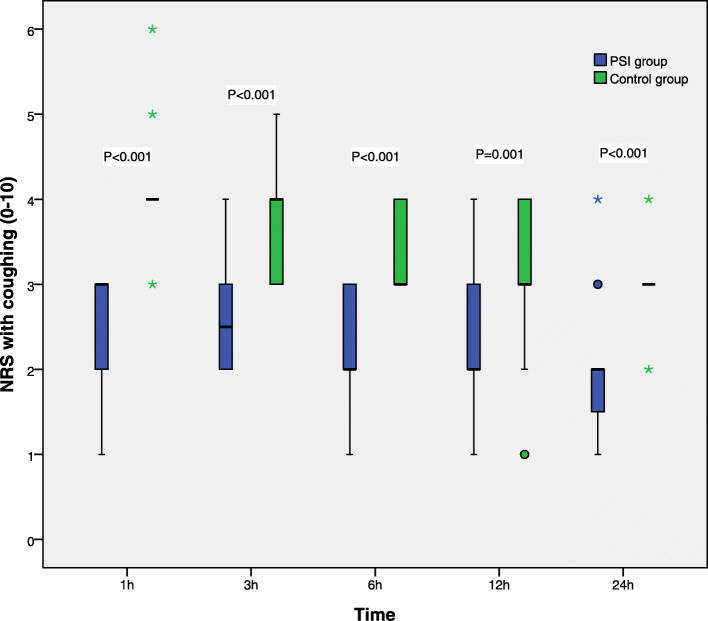
Fig. 4.
Coughing pain scores in the first 24 h after surgery. NRS scores are shown in box-and-whisker plots, which contain the interquartile range (box), range not including outliers (error bars), and median (square in the box). Extremes (> 3 box lengths) and outliers (> 1.5 box lengths) are marked by asterisks and circles, respectively. Differences in NRS scores at various time points were analyzed by the Mann-Whitney U test. Coughing pain scores at various time points were lower in the PSI group compared with control patients. NRS scores were 0 (no pain) to 10 (most severe pain)

