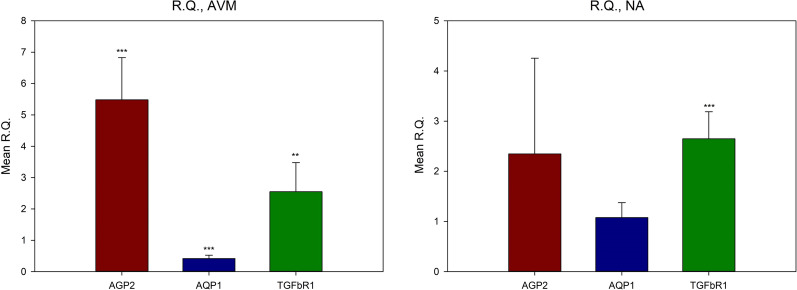
Fig. 4.
Mean relative quantities (RQs) of AVMs and normal arterial vasculature; comparing shear stress to neutral environments. Compared with neutral environments, both AVMs and normal arterial vasculature showed more gene expressions, except AQP1 when shear stress were applied. *P < 0.05, **P < 0.01, ***P < 0.001. AVM Arteriovenous malformations; R.Q. relative quantity; AGP2 Angiopoietin2; AQP1 Aquaporin1; TGFβR1 tissue growth factor beta receptor1

