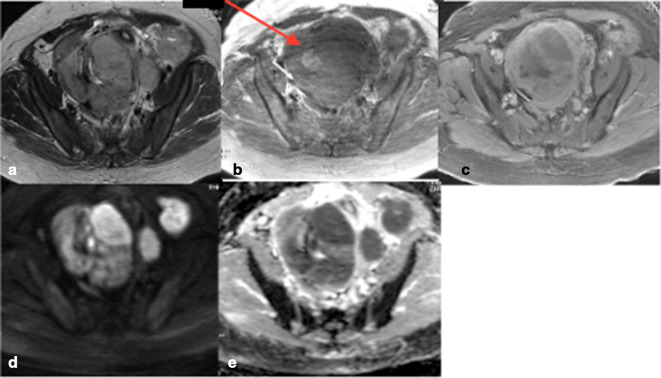
Figure 2.
(a–e) Typical LMS a. non-contrast T2 weighted image b. non-contrast T1WI. (c) Post contrast T1 weighted image with fat suppression. (d) ADC map. (e) DWI showing irregular lesion borders, intrinsic T2 hyperintensity in more than 50% of the lesion, intralesional haemorrhage (arrow 2b), peripheral “necrotic” pattern of contrast enhancement and marked restricted diffusion with corresponding high signal on DWI. ADC, apparentdiffusion coefficient; DWI, diffusion-weightedimaging; LMS, leiomyosarcoma; T1WI, T1weighted image.

