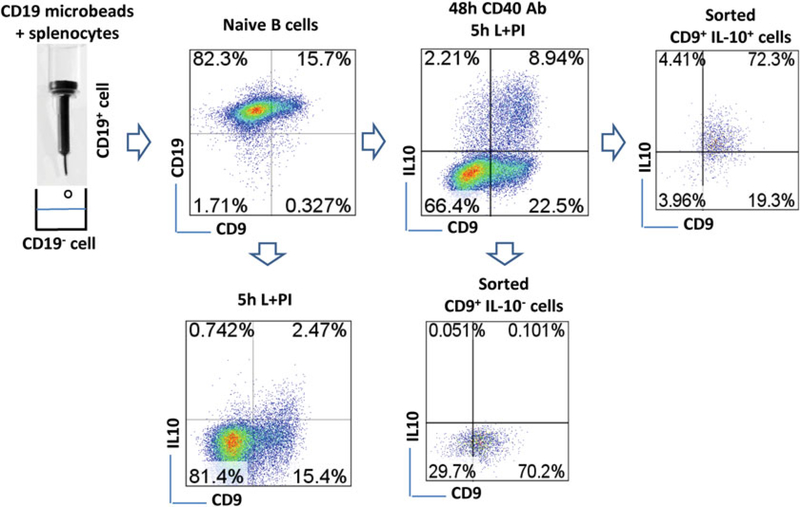
Fig. 1.
Cell sorting. Splenocytes are incubated with CD19 microbeads and then naïve CD19+ B cells are enriched through immunomagnetic separation. The frequency of CD19+CD9+ B cells is shown in the plot. Dot plots also show the expression of CD9 and IL-10 in CD19+ B cells which are treated either with LPI for 5 h or with an anti-CD40 antibody for 48 h plus LPI for the last 5 h, after staining with an IL-10 secretion assay kit as described in Subheading 3.1.4. The purity of CD9+IL-10+ and CD9+IL-10− B cells sorted from the cells cultured for 48 h is shown. After sorting, the fluorescence of the sorted cells demonstrates obvious attenuation

