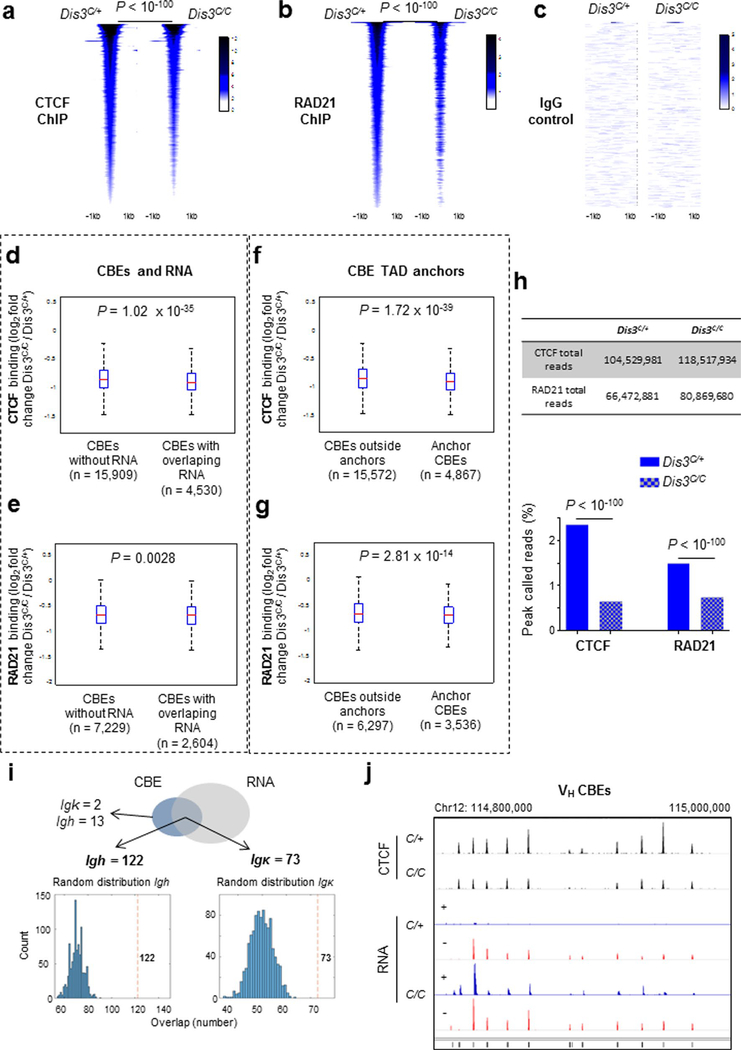
Extended Data Fig. 4 |. Genome-wide decrease of CtCF and RAD21 binding in the absence of DIS3.
a and b. CTCF and RAD21 ChIP–seq from Rosacre/+ Dis3C/+ and Rosacre/+ Dis3C/C activated B cells (biological replicates number two). Common peaks (n = 19,042 and n = 6,873 respectively) between two replicates were used in the heat map, two-tailed Wilcoxon rank-sum test. c. IgG negative control. d and e. CTCF binding and RAD21 localization to CBEs overlapped by RNA are more affected than other CBEs of the genome in the absence of DIS3. f and g. CTCF binding and RAD21 localization to TAD anchor CBEs are more affected than other part of the genome in the absence of DIS3. Panels d to g: box and whiskers plots represent ChIP values (fold changes), bottom and top whiskers represent LQ – 1.5*(UQ−LQ) and UQ + 1.5*(UQ−LQ) where LQ and UQ are lower and upper quartiles, outside interquartile range. Box plots show lower quartile, median and upper quartile, two-tailed Wilcoxon rank-sum test. h. Percentages of CTCF and RAD21 ChIP reads found inside peaks. Total number of reads was similar between Dis3C/+ and Dis3C/C (top), while reads found in peaks were decreased for CTCF and RAD21. Bar graphs show the percentage of reads inside the peaks, χ2 two-tailed proportions test. i. Analysis of ncRNAs and CBE peaks overlap. CTCF occupancy in the B cell genome was determined from control B cells (Dis3C/+) and overlapped with all ncRNAs found in Dis3C/C B cells (1 kb window). The Venn diagram shows 73 CBEs located at the Igκ and 122 CBEs at the Igh loci have overlap ncRNAs. A simulated random distribution demonstrates that the numbers are superior to what would be observed from random genomic overlaps. j. Decreased CTCF binding at Igh V CBEs. IGV tracks show some example of decreased CTCF-binding to VH CBEs where RNAs are accumulated in the absence of DIS3.

