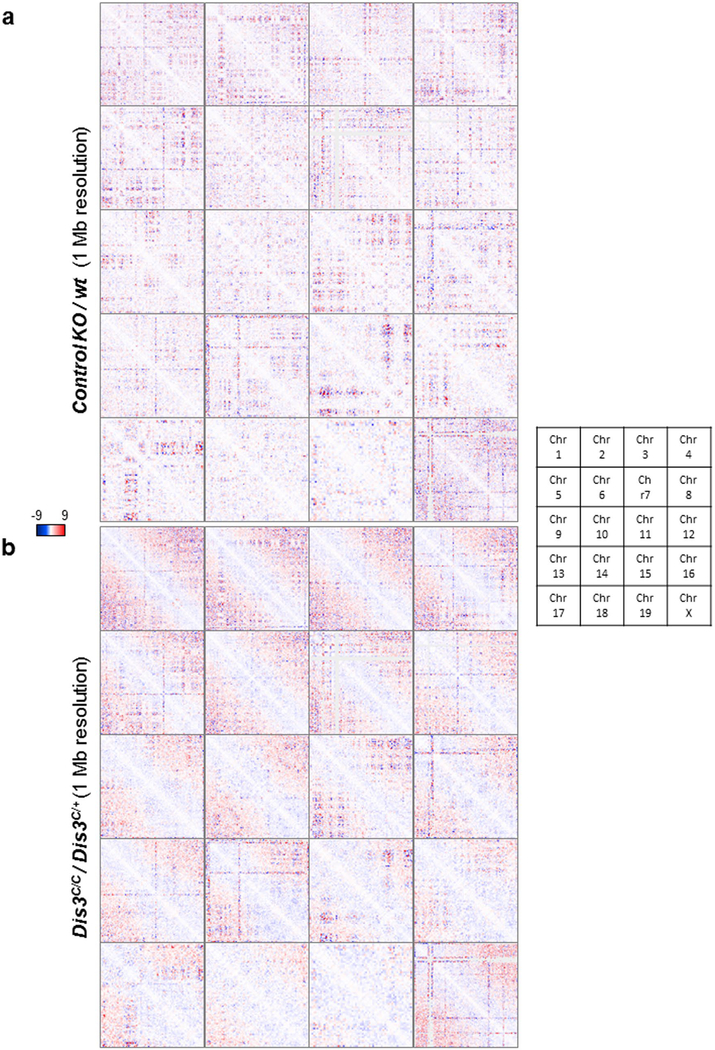
Extended Data Fig. 7 |. Genome-wide alteration in chromosome organization in DIS3-deficient B cells.
Combined data from 4 independent were used for these analyses. Hi-C data visualization using ‘Juicebox’ and DNA interaction changes on all chromosomes (1 to 19 and chromosome X). Interaction frequencies are calculated by ‘control value divided by observed value (observed/control)’, the relative gained interactions are shown in red and the relative lost interactions are shown in blue. Each square represents a full chromosome, beginning on the top left corner and finishing on the bottom right corner. a. Control KO/wt interactions are shown. An irrelevant KO (located on chromosome 12) was used to evaluate the global impact on genomic organization. Random patterns were obtained implying random gain and loss of interaction equivalent to no change. b. Dis3C/C/Dis3C/+ interactions are shown, with an obvious specific pattern of altered genomic interactions.

