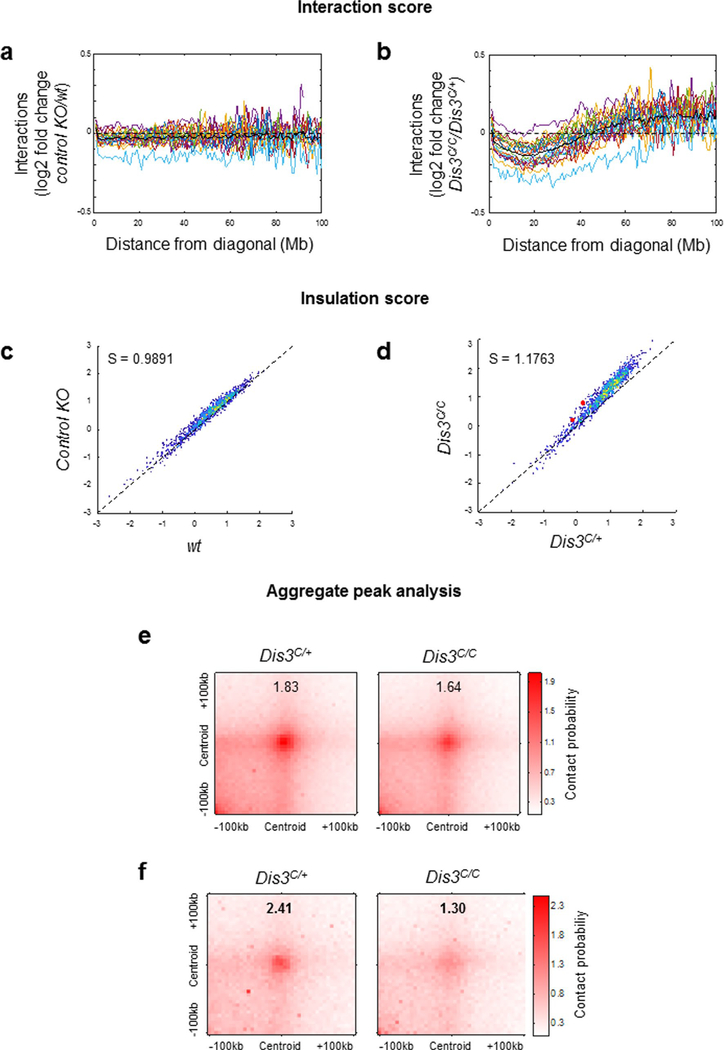
Extended Data Fig. 8 |. Quantification of chromosome alterations in DIS3-deficient B cells.
a and b. ‘Interaction score’: the average log2 fold-change of interactions along each diagonal of Hi-C maps is shown for each chromosome to evaluate the distance-dependent changes in interactions. Each colored curve represents one chromosome, and the black curve shows the average curve. These data are related to Extended Data Fig. 7. a. No differences were detected when dividing control KO by wt interactions. b. DIS3-deficiency induces a clear shift in this score, reflecting the altered patterns shown in Extended Data Fig. 7. c. Insulation scores at TAD boundaries are shown for control KO and wt activated B cells. S: slope of the fitted linear model. 1,224 insulation scores are shown. d. Insulation scores at TAD boundaries are shown for Dis3C/C and Dis3C/+ activated B cells. S: slope of the fitted linear model. 1,224 insulation scores are shown. The Igh 5′ and 3′ ends are shown as red dots. e. APA analysis showing the genome-wide loop accumulation, in control Rosacre/+ Dis3C/+ and Rosacre/+ Dis3C/C cells. A total of 800 loops were analyzed. f. APA analysis showing the loop accumulation in the top 25% differential loops in control Rosacre/+ Dis3C/+ and Rosacre/+ Dis3C/C cells. Loop interactions are defective genome-wide in the absence of DIS3, and much pronounced for the top 200 differential loops, as previously described.

