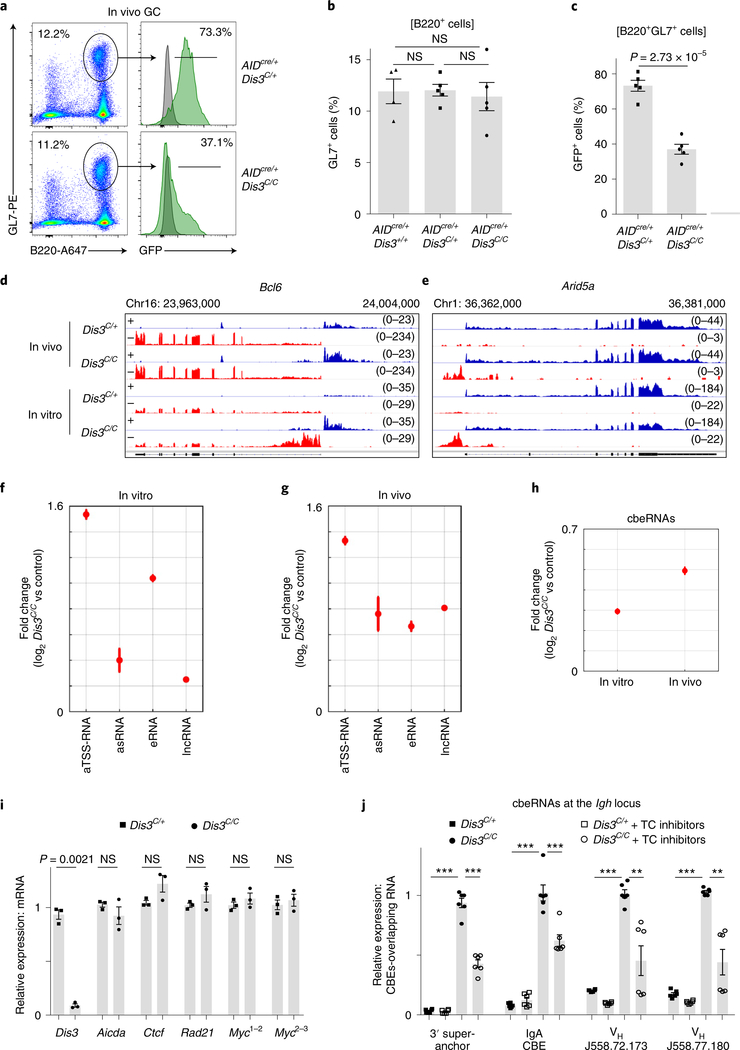
Fig. 2 |. RNA-seq from GC and in vitro activated B cells reveals new DIS3-sensitive RNAs overlapping CBEs.
a, Flow cytometry analysis of Peyer’s patches from AIDcre/+Dis3C/+ and AIDcre/+Dis3C/C mice. GFP expression was evaluated from GC B cells (B220+ and GL7+), with wild-type cells (gray) used as the control, and compared to Dis3COIN cells (green) (representative from three experiments). Dot plots show the gating strategy to study and sort GC B cells. b, Quantification of GC (B220+ and GL7+) cells by FACS from AIDcre/+Dis3+/+ (n = 4), AIDcre/+Dis3C/+ (n = 5) and AIDcre/+Dis3C/C (n = 5) Peyer’s patches cells (three independent experiments; data are the mean ± s.e.m.; two-tailed unpaired t-test). c, Quantification of GFP expression from GC B cells (n = 5, mean ± s.e.m., two-tailed unpaired t-test). d–g, DIS3-sensitive RNA substrates from in vivo GC and in vitro activated B cells. B cells were collected directly from in vivo GC cells (AIDcre/+Dis3C/+ and AIDcre/+Dis3C/C; n = 2) or from in vitro stimulations (Rosacre/+Dis3C/+ and Rosacre/+Dis3C/C; n = 2) for RNA-seq. RPGC values are shown. Owing to the use of strand-specific RNA-seq, + (blue) or − (red) indicates the two strands of DNA corresponding to the RNA being identified. d, Example of DIS3-sensitive antisense TSS RNAs and antisense intragenic RNAs at the Bcl6 locus, a hallmark of the GC reaction. e, Example of DIS3-sensitive antisense TSS RNAs and antisense intragenic RNAs at Arid5a, frequently translocated in B cells. f, Genome-wide analysis of DIS3-sensitive RNA substrates from in vitro activated B cells (n = 2; data are the mean ± standard error (s.e.)). As control, Rosacre/+Dis3C/+ in vitro activated B cells were used, which do not express ncRNAs. g, RNA-seq of AIDcre/+ Dis3C/C GC B cells (B220+, GL7+ and GFP+). The increased expression of the different ncRNA classes is shown (n = 2; data are the mean ± s.e.). As control, we used Rosacre/+Dis3C/+ in vitro activated B cells. h, Genome-wide analysis of CBE-overlapping RNAs (cbeRNAs) in vitro and in vivo. i, RT–qPCR evaluation of Ctcf, Rad21 and Myc mRNA expression at the time of Hi-C and ChIP–seq experiments (24 h after IL-4 treatment). Aicda (AID) and Dis3 were used as controls (three experiments with qPCR performed in triplicate; each point is the mean of one experiment, ± s.e.m., paired two-tailed t-test). Myc expression was evaluated using two different pairs of primers located on exons 1 and 2 (Myc1,2) or exons 2 and 3 (Myc2,3), with similar results. j, RT–qPCR evaluation of CBE-overlapping ncRNA expression 24 h after IL-4 treatment and 4 h after transcription (TC) inhibitors treatments (two experiments with qPCR performed in triplicate; each point is one qPCR value, ± s.e.m., unpaired two-tailed t-test. P = 2.03 × 10⁻⁶; P = 2.31 × 10⁻⁶; P = 2.8 × 10⁻⁵; P = 0.00091; P = 2.05 × 10⁻⁶; P = 0.0053; P = 2.54 × 10⁻¹³; P = 0.0026, from left to right).

