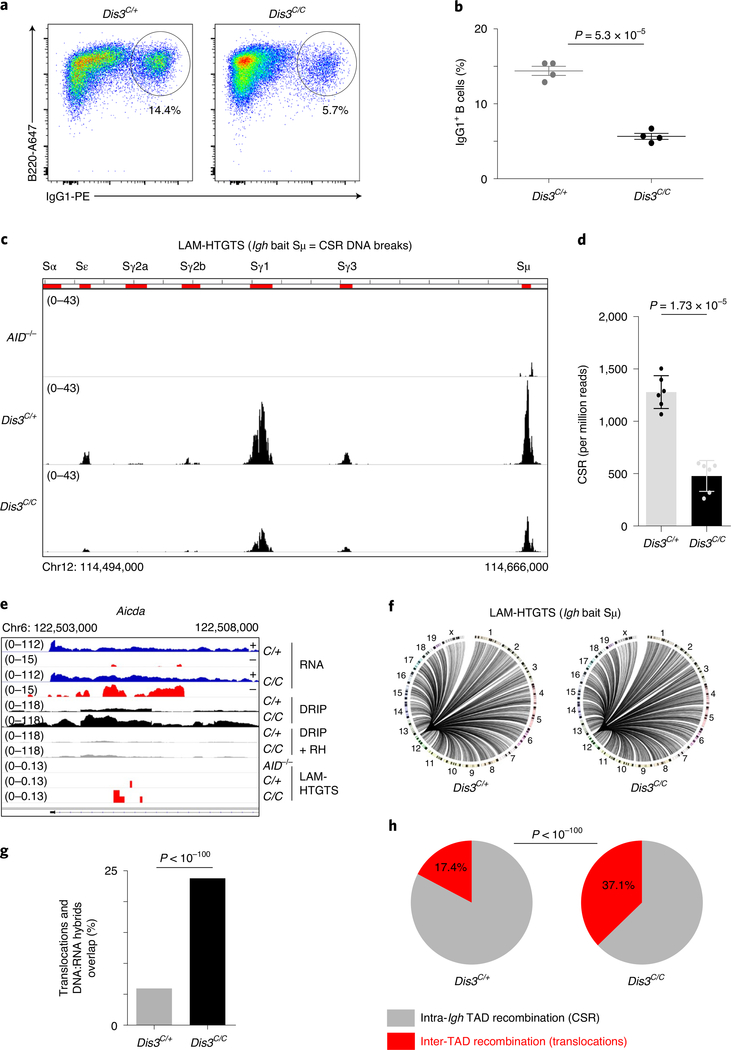
Fig. 5 |. DIS3 deficiency decreases intra-tAD class-switch recombination but increases inter-tAD aberrant translocations.
a, Flow cytometry analysis of IgG1 class switching after B-cell stimulation from Rosacre/+Dis3C/+ and Rosacre/+Dis3C/C mice (representative of four independent experiments). b, Quantification of IgG1 class switching after B-cell stimulation (four independent experiments, n = 4; data are the mean ± s.e.m., two-tailed unpaired t-test). c, LAM-HTGTS evaluation of DNA breaks at the Igh locus. Rosacre/+Dis3C/+ (n = 3), Rosacre/+Dis3C/C (n = 3) and AID−/− (n = 1) B cells were activated in vitro and treated with lipopolysaccharide (LPS) and IL-4 for 3 d before DNA extraction. Endogenous DNA recombination was evaluated using Igh bait Sμ. The different switch regions are indicated by red bars. d, Quantification of CSR DNA breaks obtained by LAM-HTGTS (three independent experiments were performed with two sequencings per experiment, each dot represents the result from one sequencing; data are the mean ± standard deviation, two-tailed paired t-test). e, Example of DNA translocations at the AID hotspot Aicda super-enhancer (intron 1 is shown). The concomitant increase of ncRNA, DNA:RNA hybrids and translocations in the absence of DIS3 is shown. Note that the RNA-seq tracks are in log scale to show all the sense and antisense accumulated RNAs. f, Circos plots showing the global DNA junctions, including translocations detected by LAM-HTGTS at the Igh locus. DNA breaks from three independent experiments are shown. g, The overlap between translocation breakpoints and DNA:RNA hybrids in Rosacre/+Dis3C/+ and Rosacre/+Dis3C/C is shown. Bar graphs represent the percentage of overlap; χ2 two-tailed proportions test. h, The proportions of intra-Igh TAD recombination (that is, CSR) and inter-TAD recombination (that is, translocation) are shown. Data were obtained from three independent experiments (with total DNA junctions of 26,750 in Dis3C/+ and 13,761 in Dis3C/C); χ2 two-tailed proportions test.

