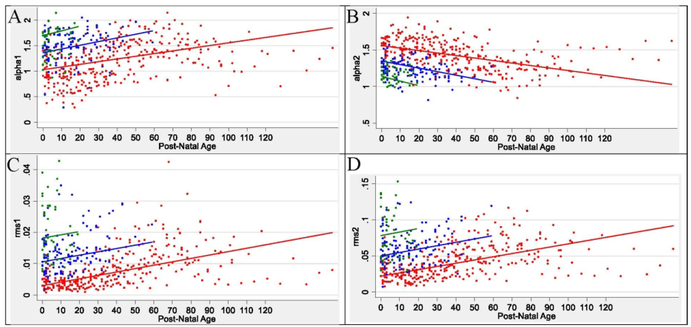
Figure 2:
ANS Time Domain Metrics Over Time in Preterm Newborn Cohort
Abbreviations: alpha 1= alpha short; alpha 2 = alpha long; RMS 1 = root mean square 1; RMS 2 = root mean square 2
Infant ANS metrics of alpha 1 (A), alpha 2 (B), RMS 1 (C), and RNS 2 (D), at each measurement session are shown as a colored dot. Red dots are for infants in group 1 with birth GA ≤29 weeks, blue dots are for infants in group 2 with birth GA of 30–33 weeks, and green dots are for infants in group 3 with birth GA ≥34 weeks. The solid colored lines represent the modeled ANS metric trajectory over time in postnatal age in days for each birth GA group.

