Fig. 9:

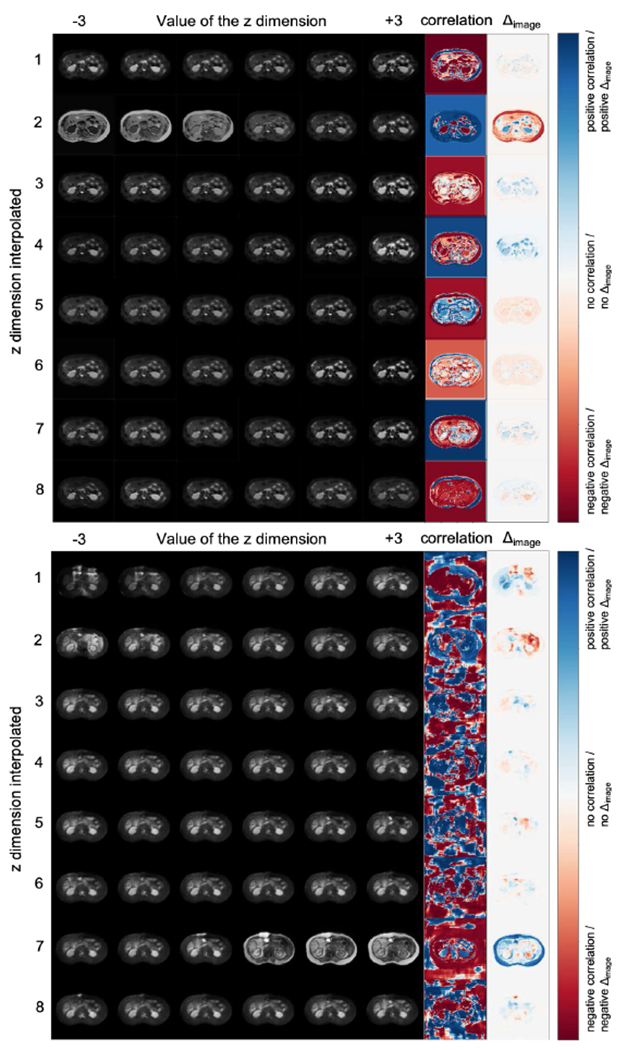
(a) FiLM and (b) SPADE based reconstructions. Images per row correspond to interpolating a single z dimension. Last two columns (correlation, and difference image Δimage), indicate regions mostly affected by each z dimension.

(a) FiLM and (b) SPADE based reconstructions. Images per row correspond to interpolating a single z dimension. Last two columns (correlation, and difference image Δimage), indicate regions mostly affected by each z dimension.