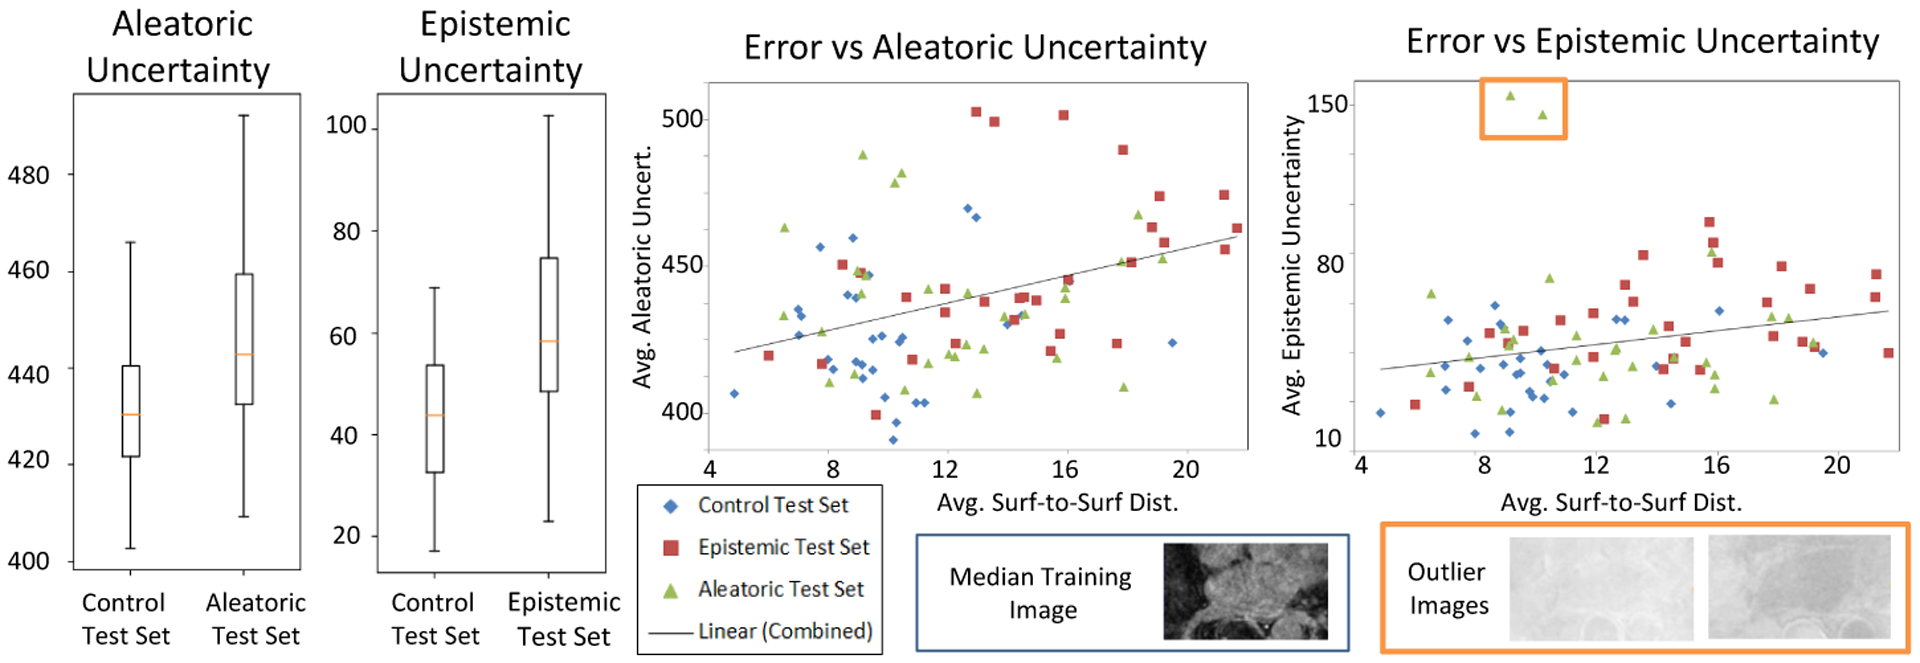
Fig.7:

Results on LA test sets from training Uncertain-DeepSSM on the full training set. The box plots show output uncertainty measures compared to the control test set. The scatter plot shows the average error versus average uncertainty on all three test sets. The two outliers marked with an orange box in the epistemic uncertainty plot are examples with images of a much higher intensity than the training examples (shown to the right) causing a spike in epistemic uncertainty.
