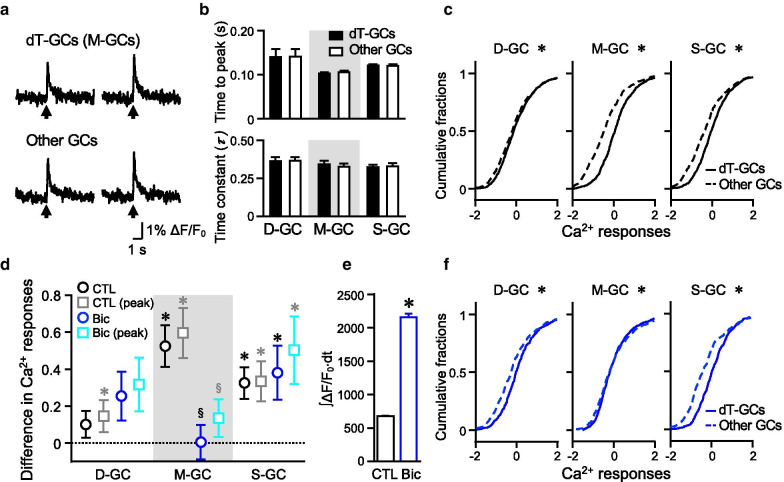
Fig. 3.
Difference in the Ca2+ increase in D-GCs, M-GCs, and S-GCs. a Examples of the time course of Ca2+ responses in individual dT-positive M-GCs and other GCs. Arrows indicate the timing of MF stimulation. b Comparison of time to peak (top) and decay time constants (bottom) of the Ca2+ responses between the dT-positive GCs (D-GCs, M-GCs or S-GCs) and their other GCs in control (n = 53, 31, or 53 slices for D-GCs, M-GCs, or S-GCs, respectively). c The cumulative distributions of the Ca2+ responses in D-GCs, M-GCs, and S-GCs (solid lines; n = 1060, 620, or 1060 cells for D-GCs, M-GCs, or S-GCs, respectively) compared with the distributions in their other GCs (dotted lines; n = 1060, 620, or 1060 cells for D-GCs, M-GCs, or S-GCs, respectively) (*p < 0.05, KS test). d Difference in Ca2+ responses between the dT-positive GCs (D-GCs, M-GCs, or S-GCs) and their other GCs in control (black open circles; n = 53, 31, or 53 slices for D-GCs, M-GCs, or S-GCs, respectively) or in the presence of bicuculline (blue open circles; n = 27, 39, or 26 slices for D-GCs, M-GCs, or S-GCs, respectively) (for the comparison with 0, *p < 0.05, one-sample Wilcoxon signed rank test; for comparison between control and bicuculline, §p < 0.05, one-way ANOVA followed by the Fisher test). Gray and cyan squares show data analyzed by using the standardized peak ΔF/F0, instead of the standardized ∫ΔF/F0∙dt. e Increase in overall Ca2+ increase upon MF stimulation by the application of bicuculline (n = 5472 GCs for control, n = 3677 GCs for bicuculline, *p = 0, Mann–Whitney test). f The cumulative distributions of the Ca2+ responses in the presence of bicuculline. The distribution is compared between D-GCs, M-GCs, or S-GCs (solid lines; n = 540, 780, or 520 cells for D-GCs, M-GCs, or S-GCs, respectively) and their other GCs (dotted lines; n = 540, 780, or 520 cells for D-GCs, M-GCs, or S-GCs, respectively) (*p < 0.05, KS test). Calculation of the Ca2+ responses in this and the subsequent figures were described in Methods

