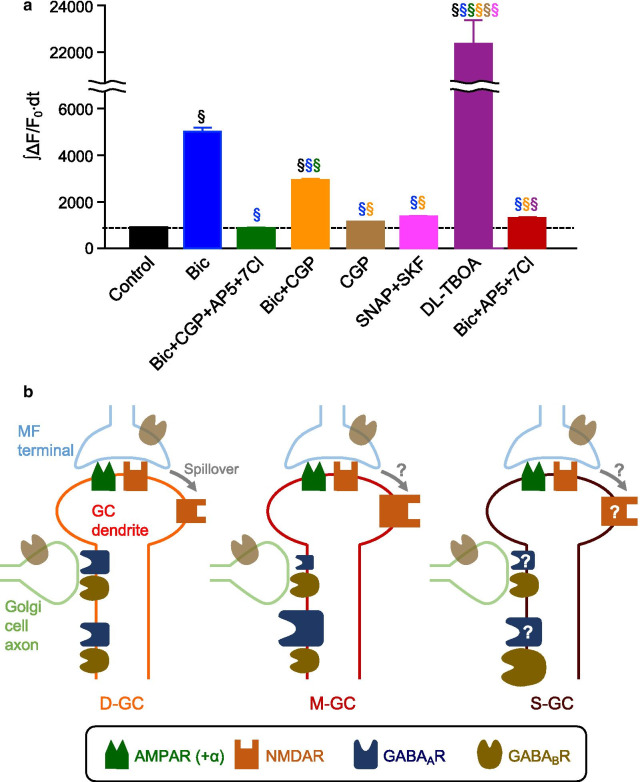
Fig. 6.
Mechanisms underlying different Ca2+ responses. a Overall Ca2+ increase, represented by ∫ΔF/F0∙dt, upon MF stimulation in the presence of inhibitors (§p < 0.05, one-way ANOVA followed by the Fisher test, color symbols indicate the comparison with conditions for which the results are shown in that color). Numbers of cells analyzed are as follows: n = 3680 (control); n = 1800 (Bic); n = 1960 (Bic + CGP + AP5 + 7Cl); n = 2200 (Bic + CGP); n = 1840 (CGP); n = 2120 (SNAP + SKF); n = 1640 (DL-TBOA); n = 3240 (Bic + AP5 + 7Cl). b Diagram of possible mechanisms that produce differences in MF-dependent Ca2+ increase in D-GCs, M-GCs and S-GCs

