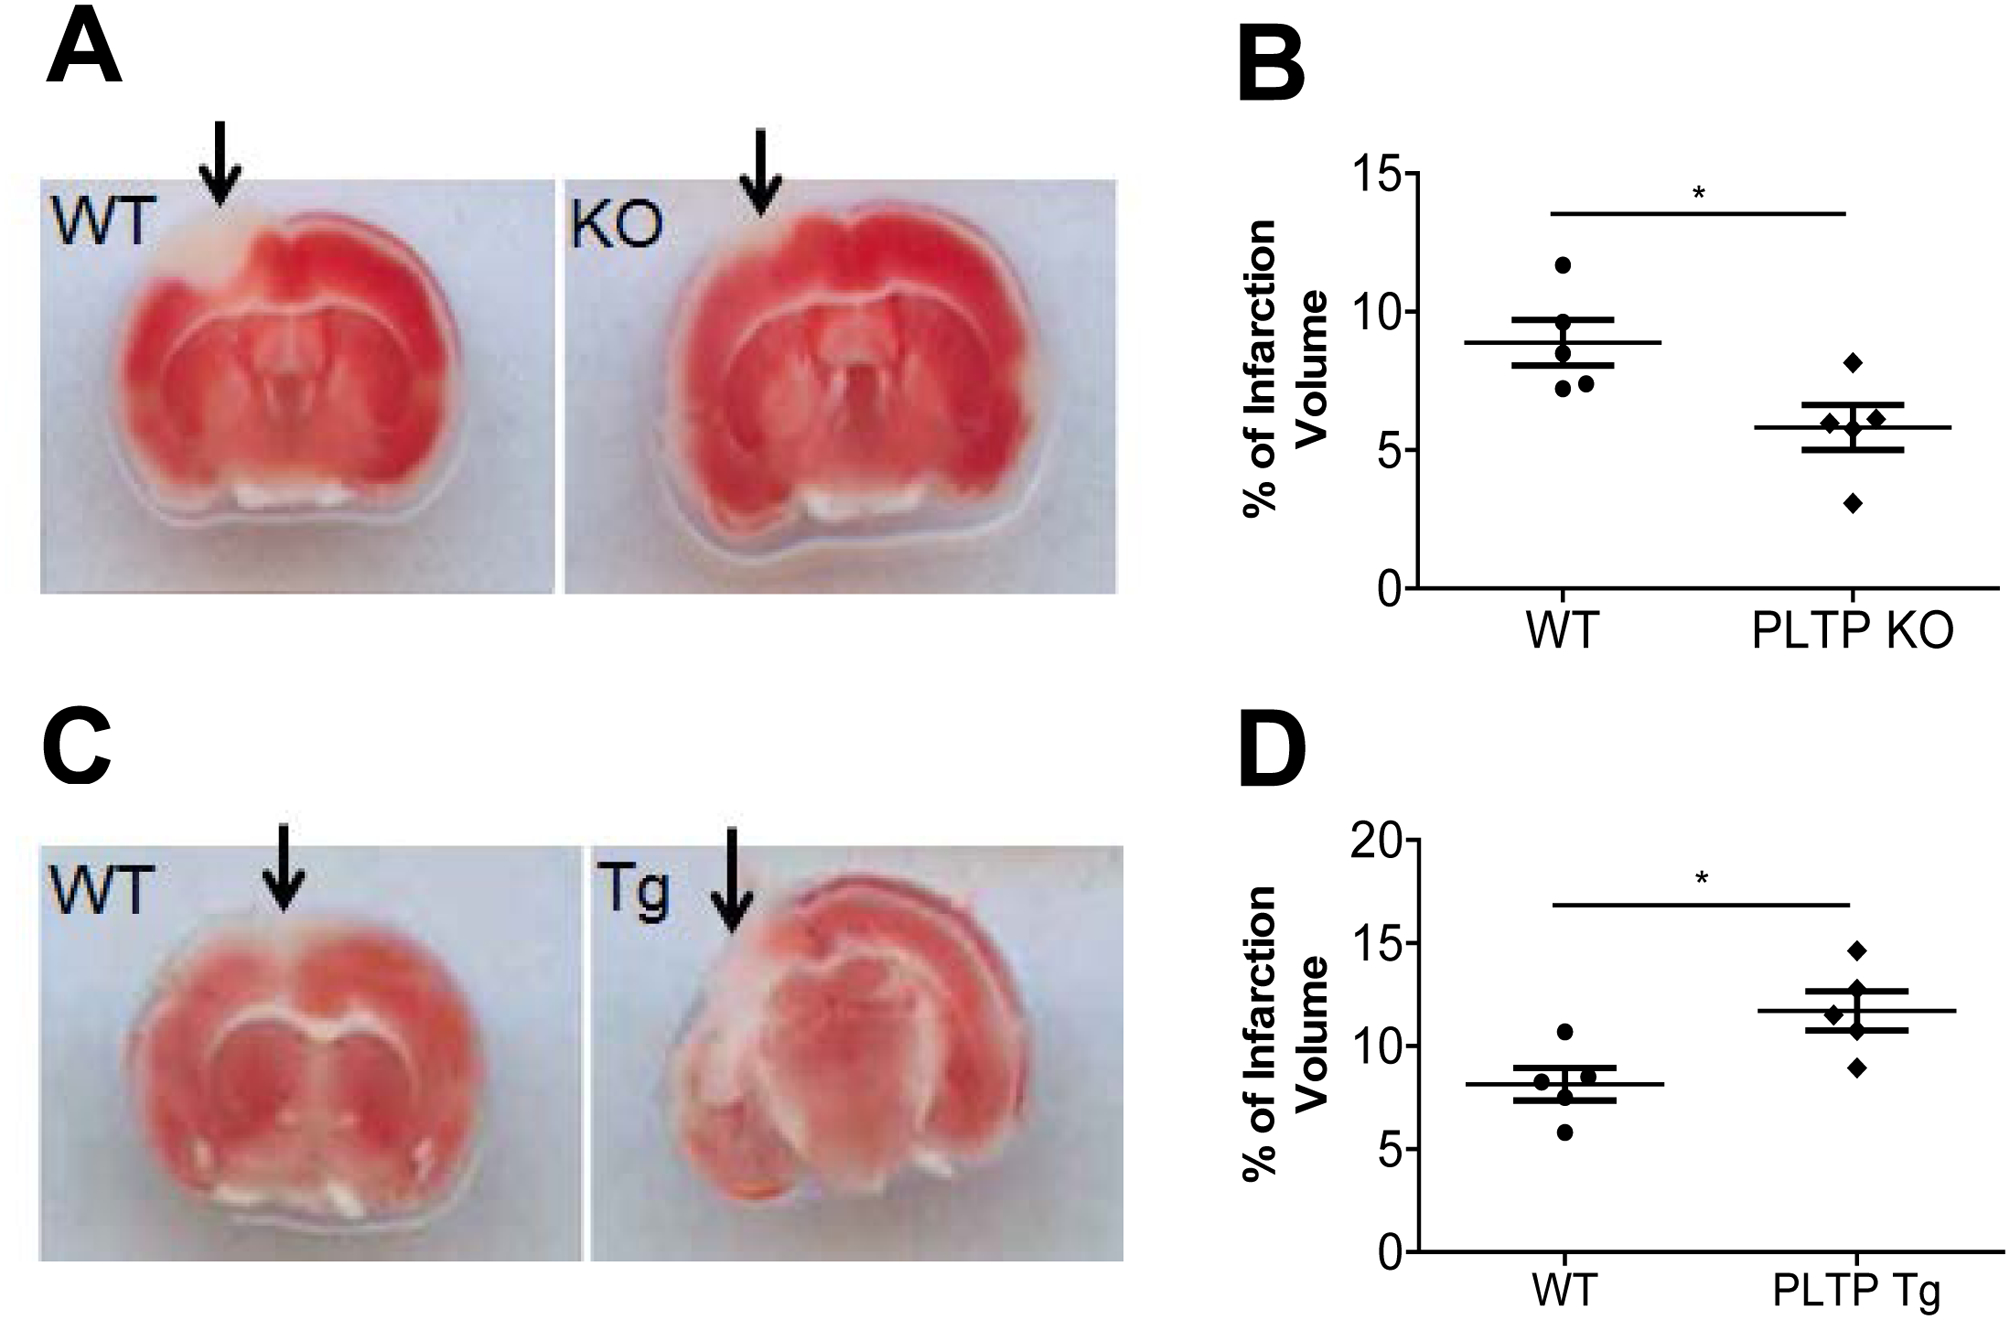
Figure 6. Photothrombosis and assessment of cerebral infarct size.

Photothrombosis was performed as described in “Materials and Methods”. At 24 h post-induction of photothrombotic stroke, the mice were euthanized, and living versus dead cells were quantified in triphenyl tetrazolium chloride–stained sections. (A) and (B) Images of intravascular thrombosis (A) and quantification (B) in WT and PLTP KO mouse brain. (C) and (D) Images of intravascular thrombosis (C) and quantification (D) in WT and PLTP Tg mouse brain. Arrows indicate the infarct site. Values represent the mean ± SD, n = 5, *P < 0.05.
