Figure 3.
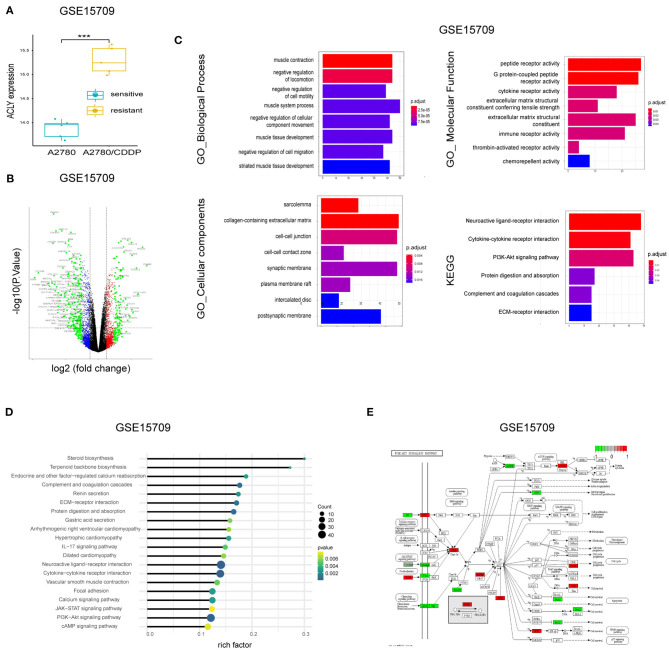
Bioinformatic analysis showed ACLY is upregulated in A2780/CDDP cells. (A) ACLY was upregulated in A2780/CDDP cells compared with A2780 cells in GSE15709 dataset. (B) The volcano plot on DEGs between A2780 and A2780/CDDP in GSE15709 dataset. (C) The GO enrichment and KEGG enrichment of DEGs between A2780/CDDP and A2780, the filtering condition was p < 0.05. (D) KEGG enrichment of DEGs of GSE15709 calculated and weighted by rich factor. (E) Pathway viewer of PI3k/AKT, the red units mean upregulated in A2780/CDDP, and the green units mean downregulated in A2780/CDDP, the darker the color is, the less the P-value is. ***P < 0.001 for statistical analysis of the indicated groups.

