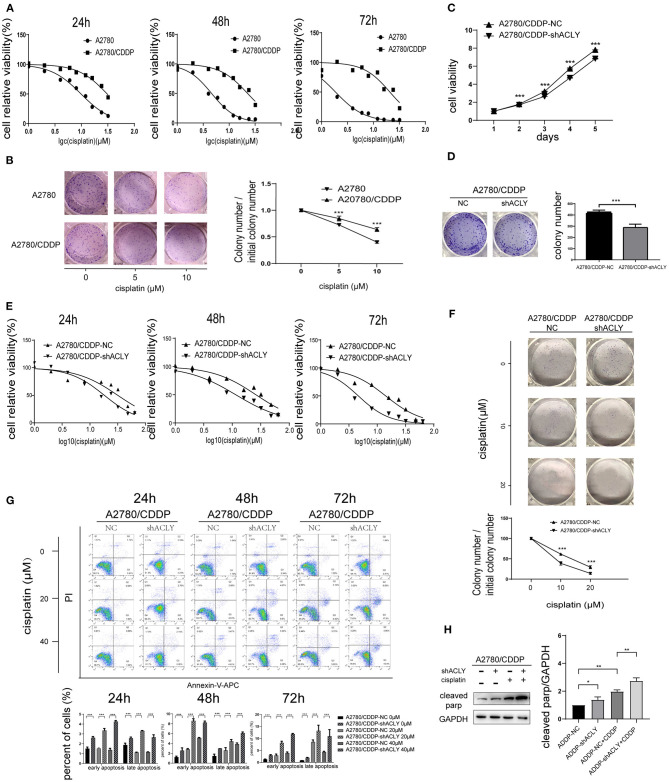
Figure 4.
ACLY knockdown re-sensitized A2780/CDDP cell to platinum. (A) 24, 48, and 72 h IC50 were measured after treatment of cisplatin with concentration gradients. Twenty-four hours IC50 of A2780 and A2780/CDDP were 9.827 (9.316–10.36) and 30.75 (28.91–33.03) μM, respectively, 48 h IC50 were 4.593 (4.355–4.838) and 22.68 (20.88–24.89) μM, respectively, 72 h IC50 were 1.861 (1.749–1.976) and 20.76 (18.39–23.85) μM, respectively. (B) Colonies formation assays and the survival ratio of A2780 and A2780/CDDP cells treated with different concentration of cisplatin, colony numbers were counted and analyzed using Student's t-test. (C) MTT assays were used to measure the proliferative ability of ACLY knockdown A2780/CDDP cells and their corresponding NC cells, the growth curves were analyzed using one-way ANOVA test. (D) Colony formation assays were performed and analyzed in ACLY knockdown cells and their corresponding NC cells, colony numbers were counted and analyzed using Student's t-test. (E). IC50 of cisplatin of 24, 48, and 72 h after cisplatin gradients added. Twenty-four hours IC50 in A2780/CDDP-NC cells and A2780/CDDP-shACLY cells were 31.71 (26.49–38.15) and 16.64 (14.26–19.30) μM, respectively, 48 h IC50 were 26.07 (22.83–29.74) and 11.55 (10.43–12.76) μM, respectively, 72 h IC50 were 14.16 (12.31–16.19) and 4.648 (4.138–5.227) μM, respectively. (F) Colony formation assays were performed in the aforementioned cells under treatment with different concentration of cisplatin, colony numbers were counted and analyzed using Student's t-test. (G) Apoptosis assays were measured in cells treated with different concentrations and different time of A2780/CDDP-NC and A2780/CDDP-shACLY cells. Quantitive analysis of apoptotic ratio by flowjo V10 software. Statistical analysis was performed using Student's t-test. (H) cleaved parp was measured and quantified in A2780/CDDP-NC and A2780/CDDP-shACLY cells with or without cisplatin treated, the concentration of cisplatin was 20 μM. The bands were quantitated with Image J software, statistical analysis was performed using Student's t-test. All cell experiments were repeated three times at least. *P < 0.05, **P < 0.01, ***P < 0.001, and ****P < 0.0001 for statistical analysis of the indicated groups.

