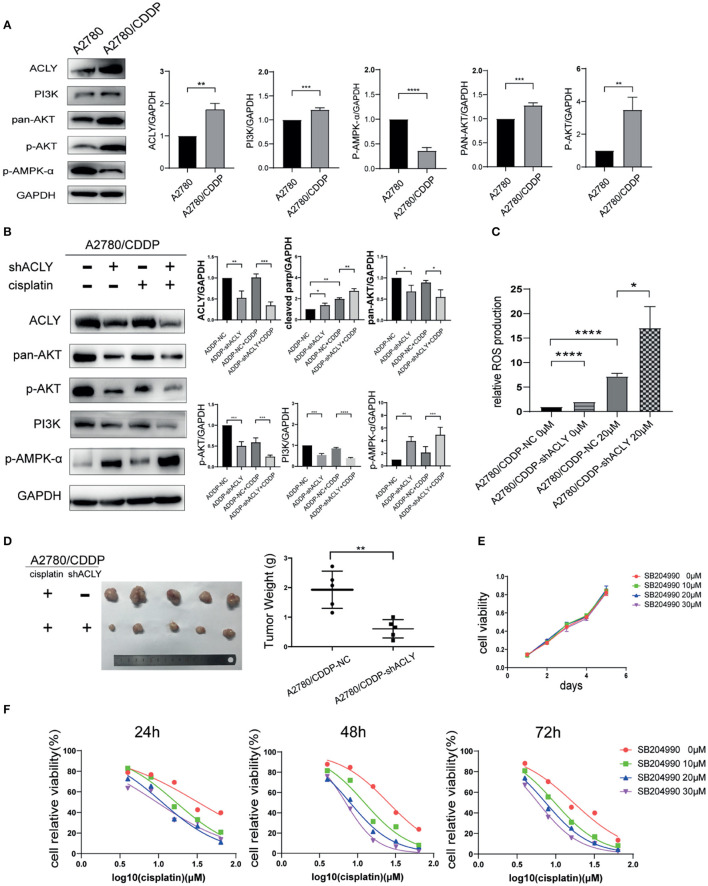
Figure 5.
ACLY knockdown inhibited PI3K/AKT pathway and activated AMPK pathway. (A) Western blotting was used to detect the differential expression of ACLY, PI3K/AKT pathway and p-AMPK-α in A2780 and A2780/CDDP cells. (B) Western blotting on A2780/CDDP-NC and A2780/CDDP-shACLY cells, and them under 20 μM cisplatin treatment for 48 h, the bands were quantified and analyzed. The bands were quantitated with Image J software, statistical analysis was performed using Student's t-test. (C) ROS production of the aforementioned cells and them under treatment of 20 μM cisplatin for 48 h, statistical analysis was performed using Student's t-test. (D) Tumor xenograft formation of A2780/CDDP-NC and A2780/CDDP-shACLY cells with treatment of cisplatin, with each group containing five mice. The difference in tumor weights was compared using Student's t-test. (E) Proliferation of A2780/CDDP cells in respond to different concentration (low-dose, 10–30 μM) of SB-204990, the growth curves were analyzed using one-way ANOVA test. (F) 24, 48, and 72 h IC50 of A2780/CDDP cells under treatment of cisplatin combined with different concentration of SB-204990 (from 0 to 30 μM), 24 h IC50 of which were 32.34 (26.71–40.60), 16.75 (15.24–18.43), 11.08 (9.736–12.55), 9.495 (7.759–11.38) μM, respectively; 48 h IC50 of which were 25.37 (23.86–27.00), 12.33 (10.74–14.13), 7.983 (7.487–8.499), 6.979 (6.749–7.215) μM; 72 h IC50 of which were 16.96 (14.89–19.34), 9.727 (9.294–10.18), 7.407 (7.083–7.741), 5.922 (5.601–6.246) μM, respectively. All cell experiments were repeated three times at least. *P < 0.05, **P < 0.01, ***P < 0.001, and ****P < 0.0001 for statistical analysis of the indicated groups.

