
Fig. 1.
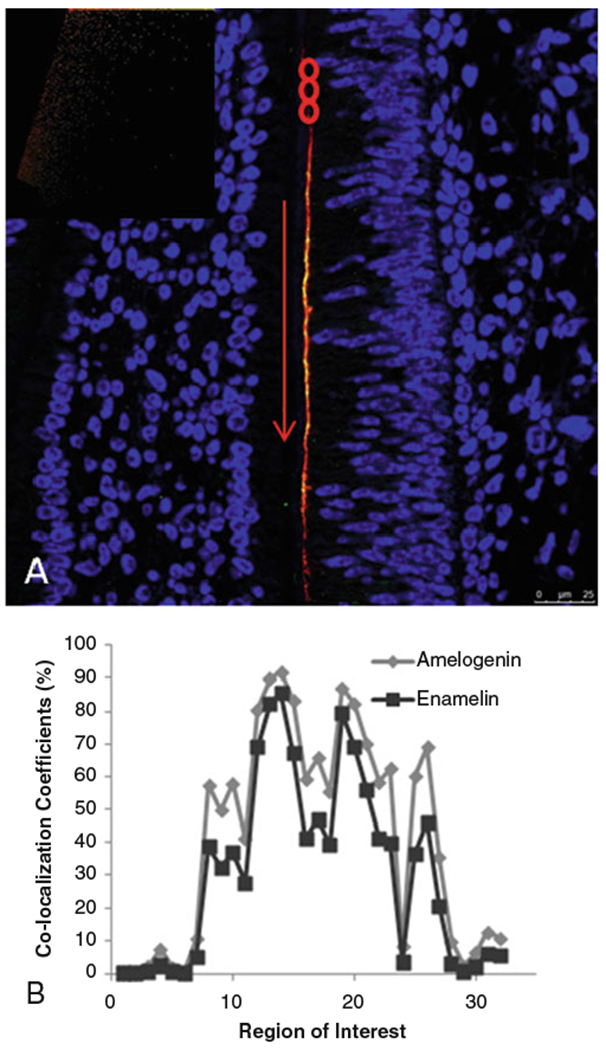
Confocal image of postnatal day 1 mouse mandibular molar showing (a) regions of interest (red circles) selected for quantitative co-localization analysis along the secretory face of ameloblasts; (b) graph of co-localization coefficients from ROIs shown in a. Inset—scatterplot showing distribution of red and green pixels. Reproduced with permission from Ref. [1]