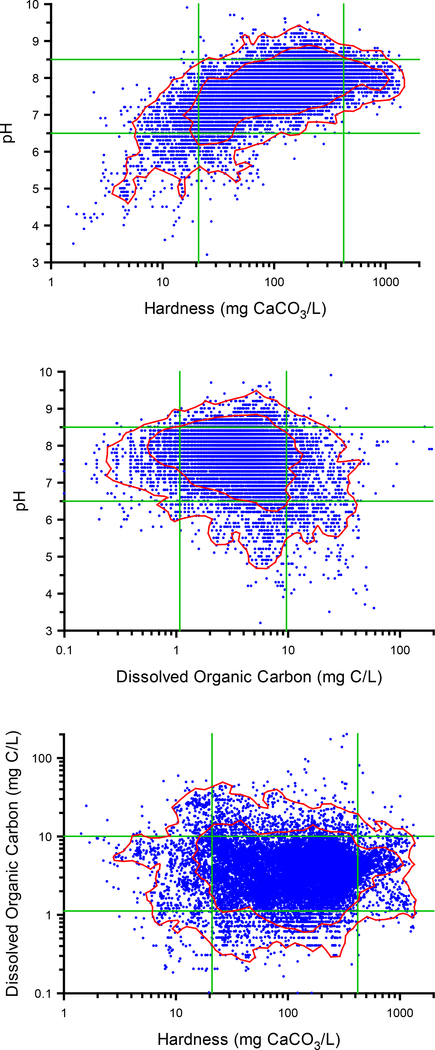
Figure 2.
Pairwise relationships between hardness, pH, and DOC in natural waters occurring across the US (n = 22,076). Green lines represent 5th and 95th percentiles of each parameter. Red lines denote constant-density contours enclosing 905 and 99% of the data based on kernel density estimation (see Supplemental Information for analysis methods). Data from Ryan (Unpublished).

