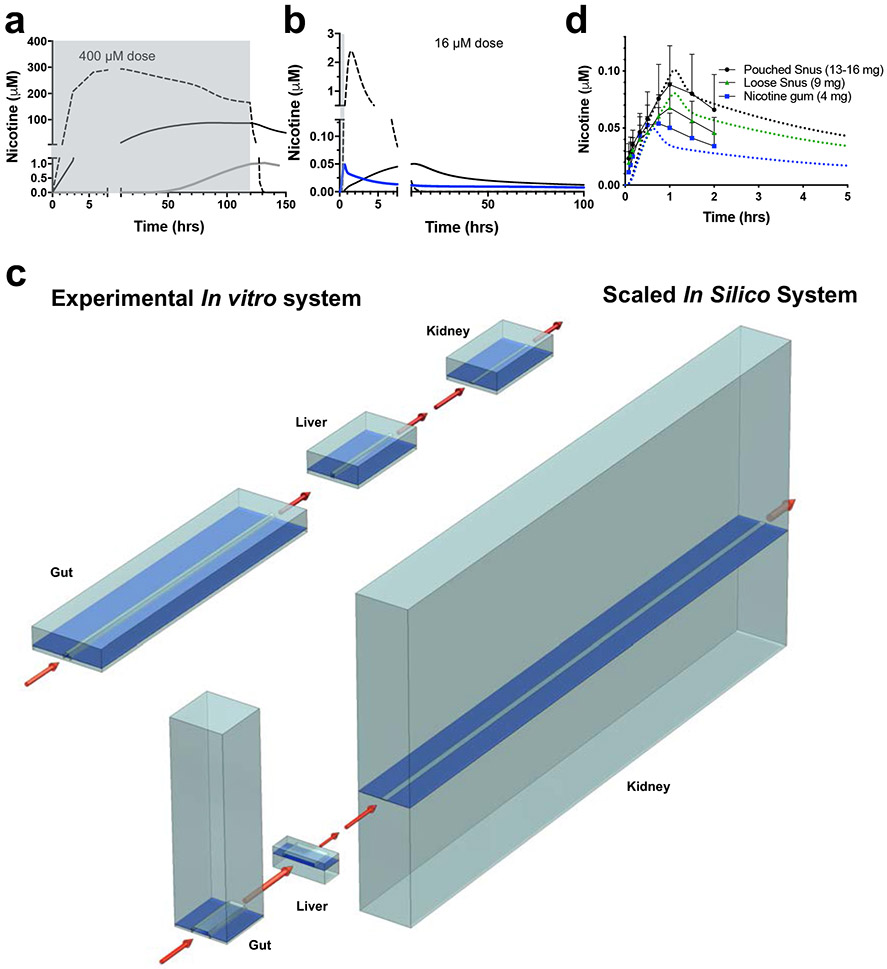
Fig. 3. In vitro-to-in vivo translation (IVIVT) of human pharmacokinetic (PK) parameters for nicotine using the multi-Organ Chip first pass platform.
(a) Graph showing the oral dose (~400 μM) of nicotine infused into the upper parenchymal channel of the Gut Chip (gray shaded area) and nicotine levels measured in the AV Reservoir over time in the real experimental system with discrete linkages every 12 hrs and package loss into the PDMS (gray solid line) versus computational DMPK model predictions of nicotine levels in which the same results were simulated as a continuous flow system with (black solid line) or without (dashed line) package loss. (b) Predictions of nicotine levels in the AV Reservoir using the same computational DMPK model as shown in a with a clinical nicotine dose of 16.15 μM and 30 min infusion (gray shaded area) compared with the same results were simulated as a continuous flow system with (black solid line) or without (dashed line) package loss. The blue line shows that the in silico multi-Organ Chip IVIVT platform made PK predictions for nicotine that much more closely match that rapid PK dynamics of human blood nicotine values using a continuous flow simulation after it was optimized for physiological differences in cell mass and blood flow between the different organs in vivo, drug loss into the chip material, and the geometry of endothelial channels to mimic drug transport. (c) Schematics comparing the actual relative Organ Chip channel volumes, flow rates, and geometries shown in cross-section in the linked multi-Organ system (top) and the scaled values for these properties used for the IVIVT simulations (bottom). (d) Graph showing that changes in nicotine blood concentrations over time predicted by the optimized, scaled, in silico multi-Organ Chip IVIVT platform for three different oral doses (different colored dashed lines) closely match previously published blood nicotine levels measured in human patients receiving orally administered nicotine in the form of nicotine gum (blue; same curve as the blue curve in b shown at different scale), pouched snus (black) or loose snus (green) at three different doses (4, 9, and 13-16 mg, respectively)28. Similar results were obtained in two separate studies, each with three independent fluidically linked multi-Organ Chip systems.

