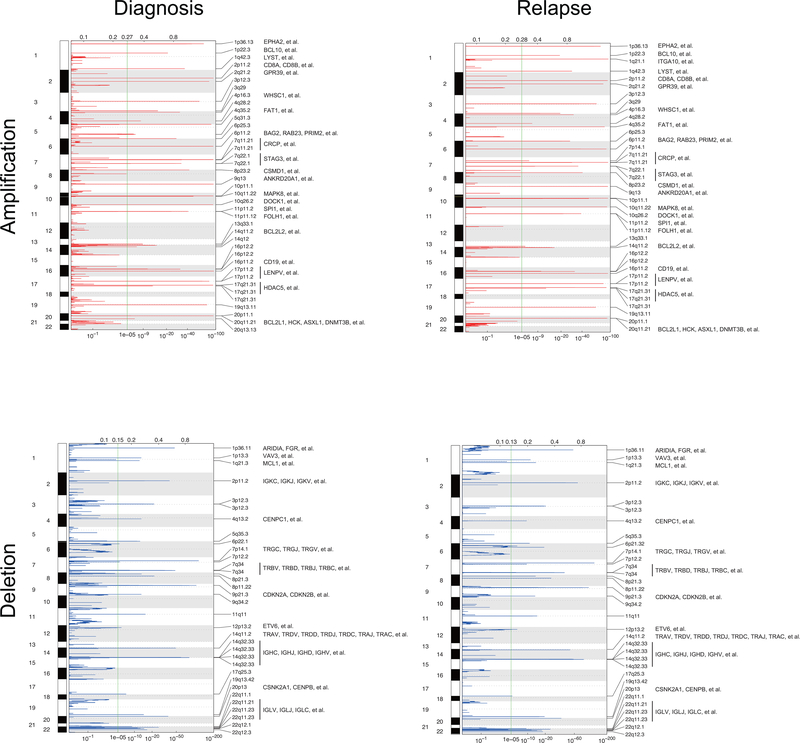
Extended Fig. 6 |. Copy number alterations in diagnostic and relapse ALL samples.
Human chromosomal ideograms showing the areas of genetic gain and loss identified by whole exome sequencing, whole genome sequencing or Genome-Wide Human SNP Array 6.0 (Affymetrix) in 103 B-precursor ALL samples and 46 T-cell ALL samples at diagnosis and relapse (rel). Green bars represent areas of loss. Red bars represent areas of gain.

